
 Facebook
 X
X
 Pinterest
 Copy Link
March stats are out and I'm going to give a longer perspective of what's been going on over the past 5 years…
In my February stats post, I pointed out how big an uptick we had for pending sales. Well, that trend continued in March. For King County, pending sales in March were up 57.6% from February and up 105% from last March. Sold and closed properties increased 54.2% from February and 66.1% from last March. Active listings increased 8.8% from February but are down 8.5% from last March. All this just confirms the improving trend of increasing sales with only a moderate increase in inventory.
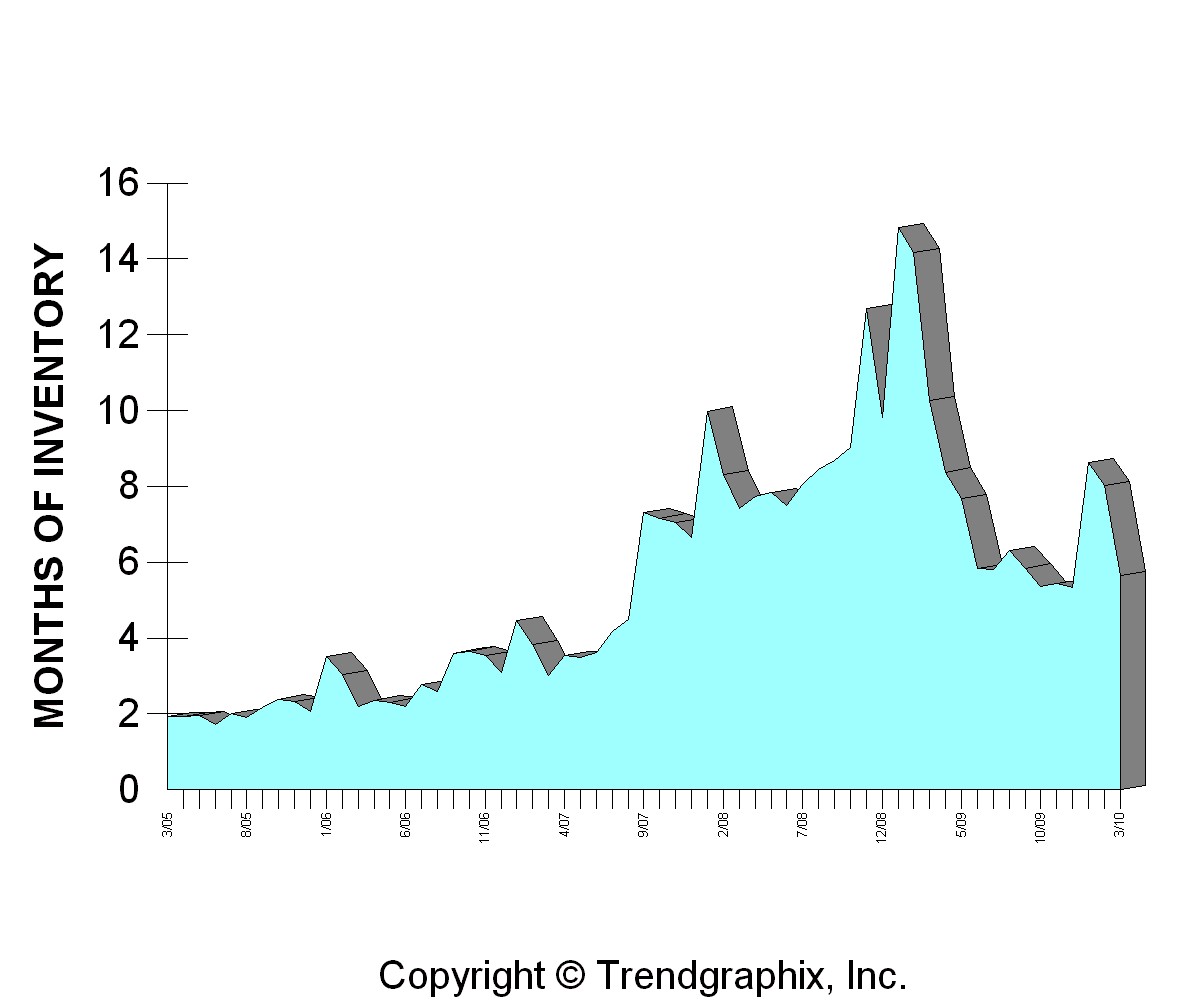
As promised, I will also give a longer perspective as well– As you can see in the following chart, inventory is still much greater than it was 5 years ago, and the sales are lower, but it's much improved since the middle of 2008. Looking back at 2005, you can see that nearly half of the inventory was being sold every month! Or in other terms, there was 2 months of inventory. Currently, we are running at about 6 months of inventory. That is closer to the historical average, but happily nowhere near the peak of about 15 months of inventory that we reached in the beginning of 2009.
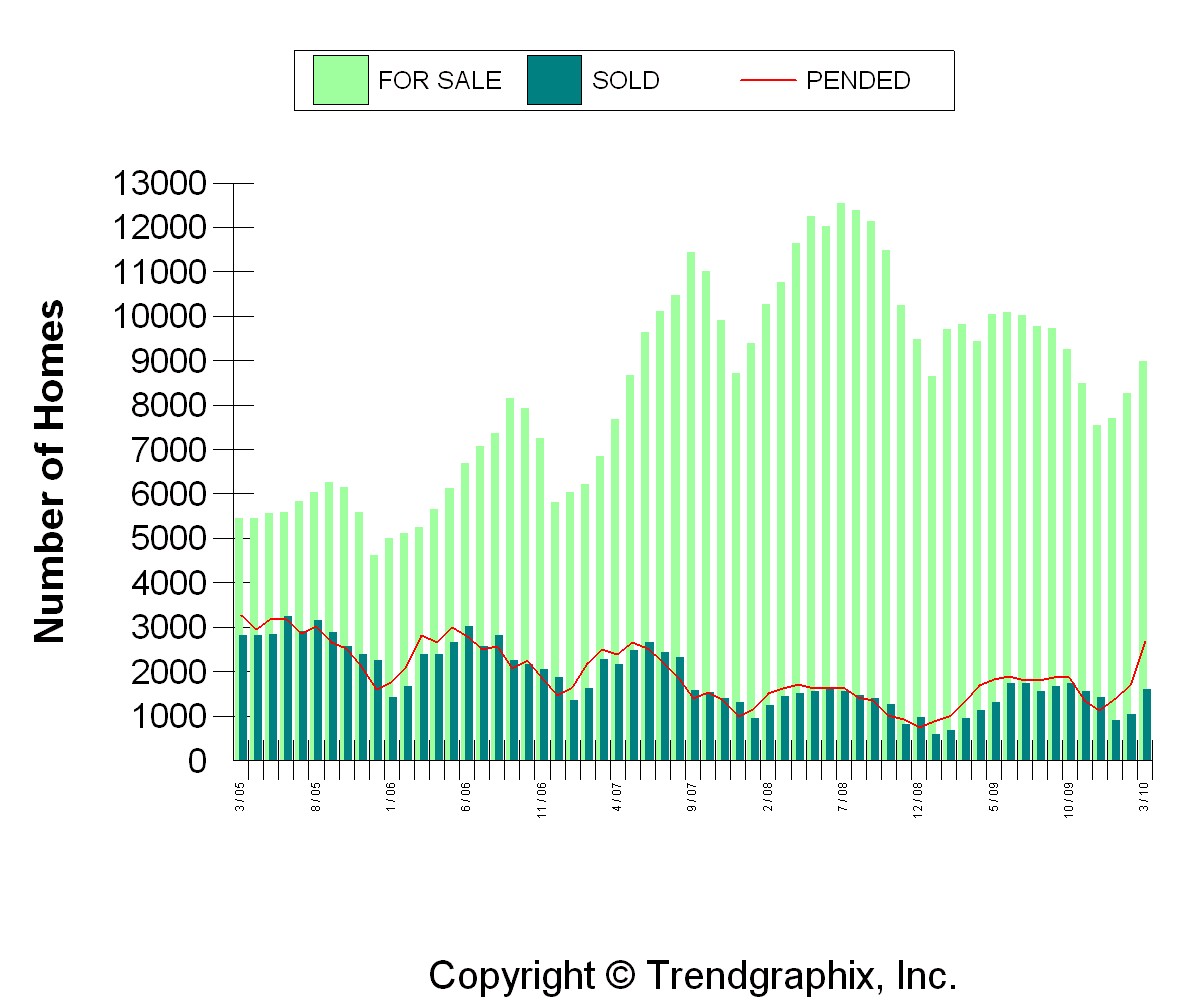
As far as sold prices go, King County is averaging $456,000 and $207/sqft, which is pretty flat compared with February, but up 5-6% or so from last March. Again, to put it in a longer term perspective, the current prices are still up about 7% from March of 2005. But, they are down 22-24% from the peak in the middle of 2007.


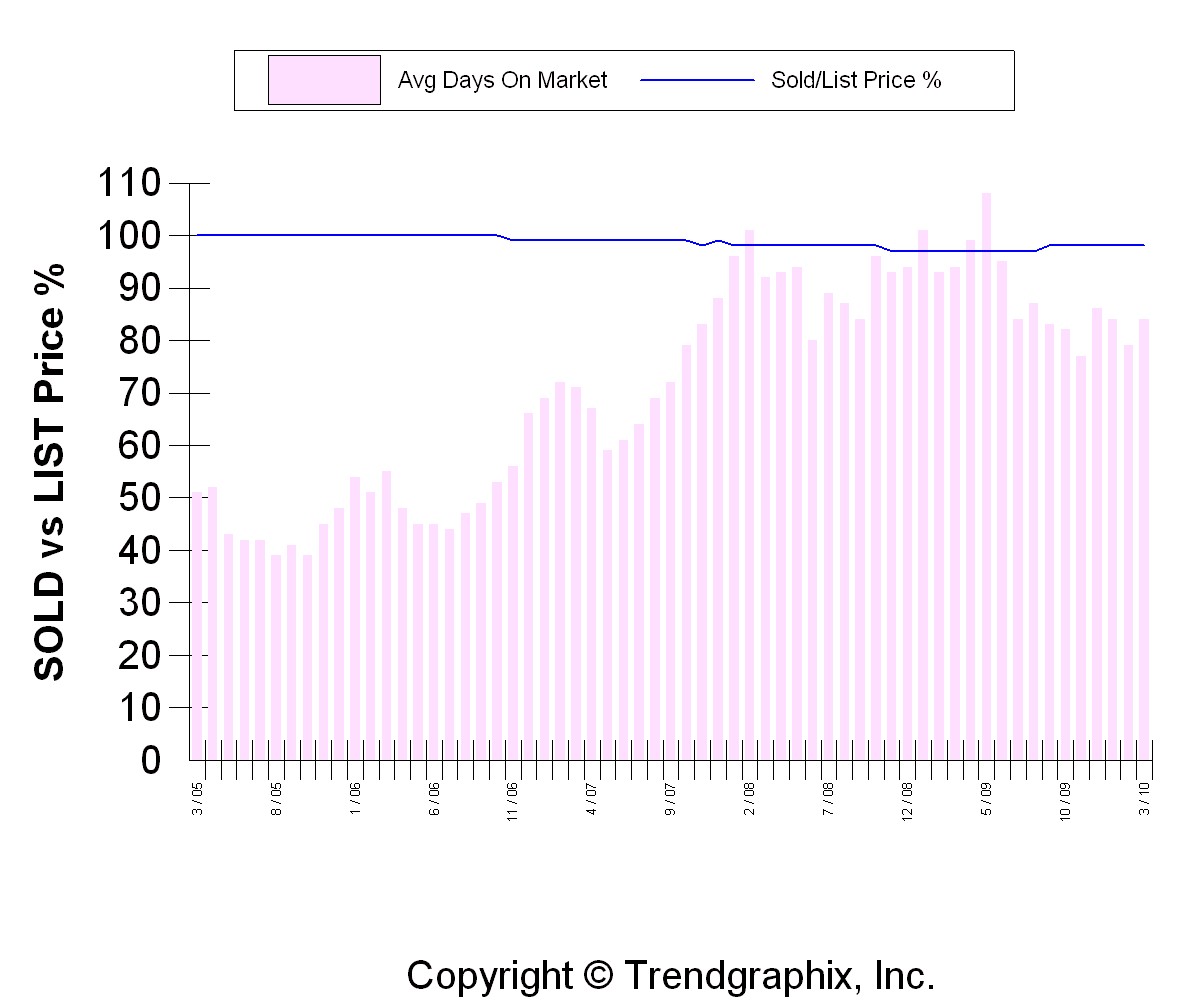
These last two King County charts show that the average days on market is running at about 73 and the sold price as a percentage of list price is at 96%. That's been fairly consistent over the past year but look how the AVERAGE was at 100% 5 years ago. The second chart shows the months of inventory as a graph over the past 5 years. If we can keep that in the 3-7 month range, we will be doing just fine.

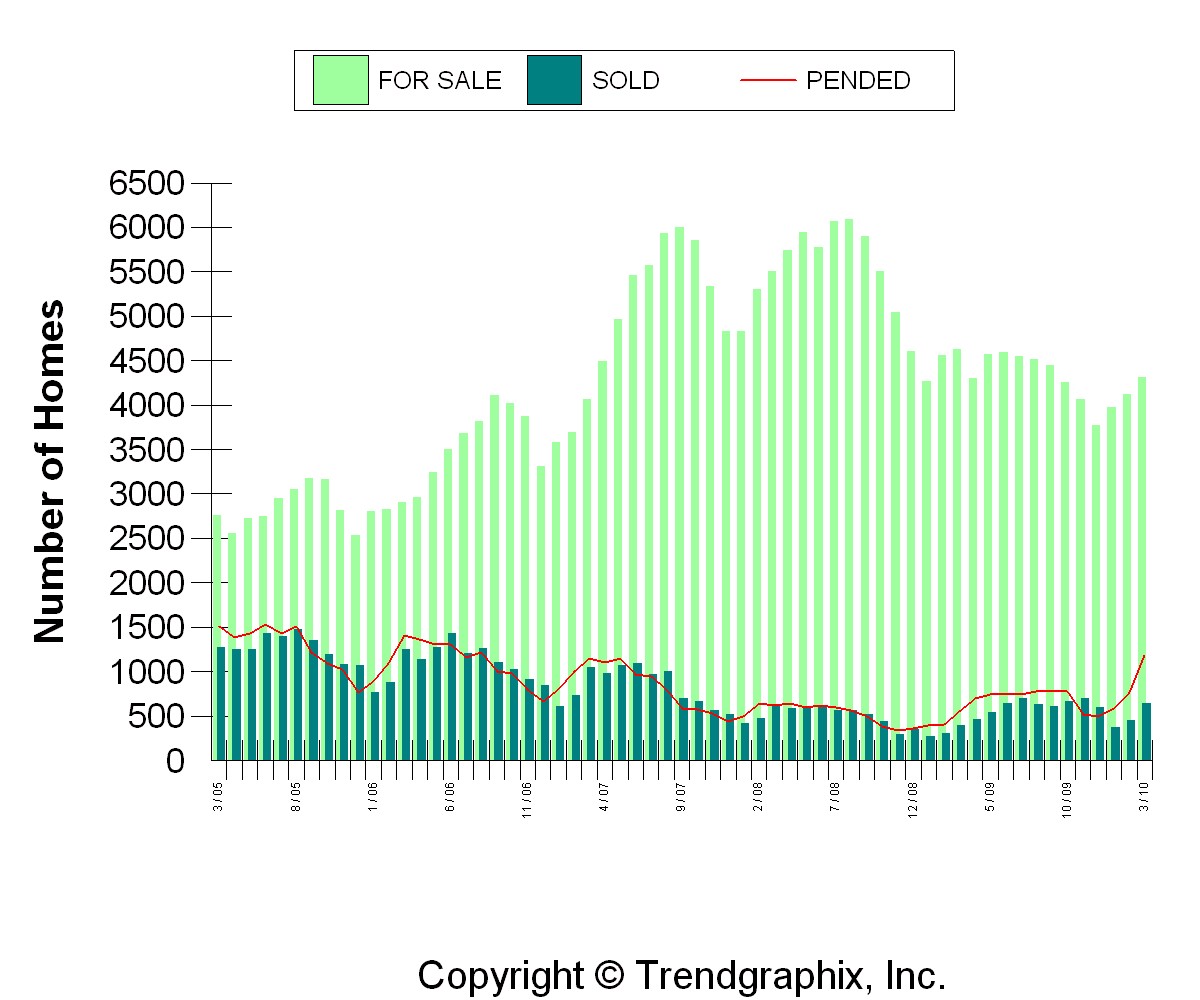
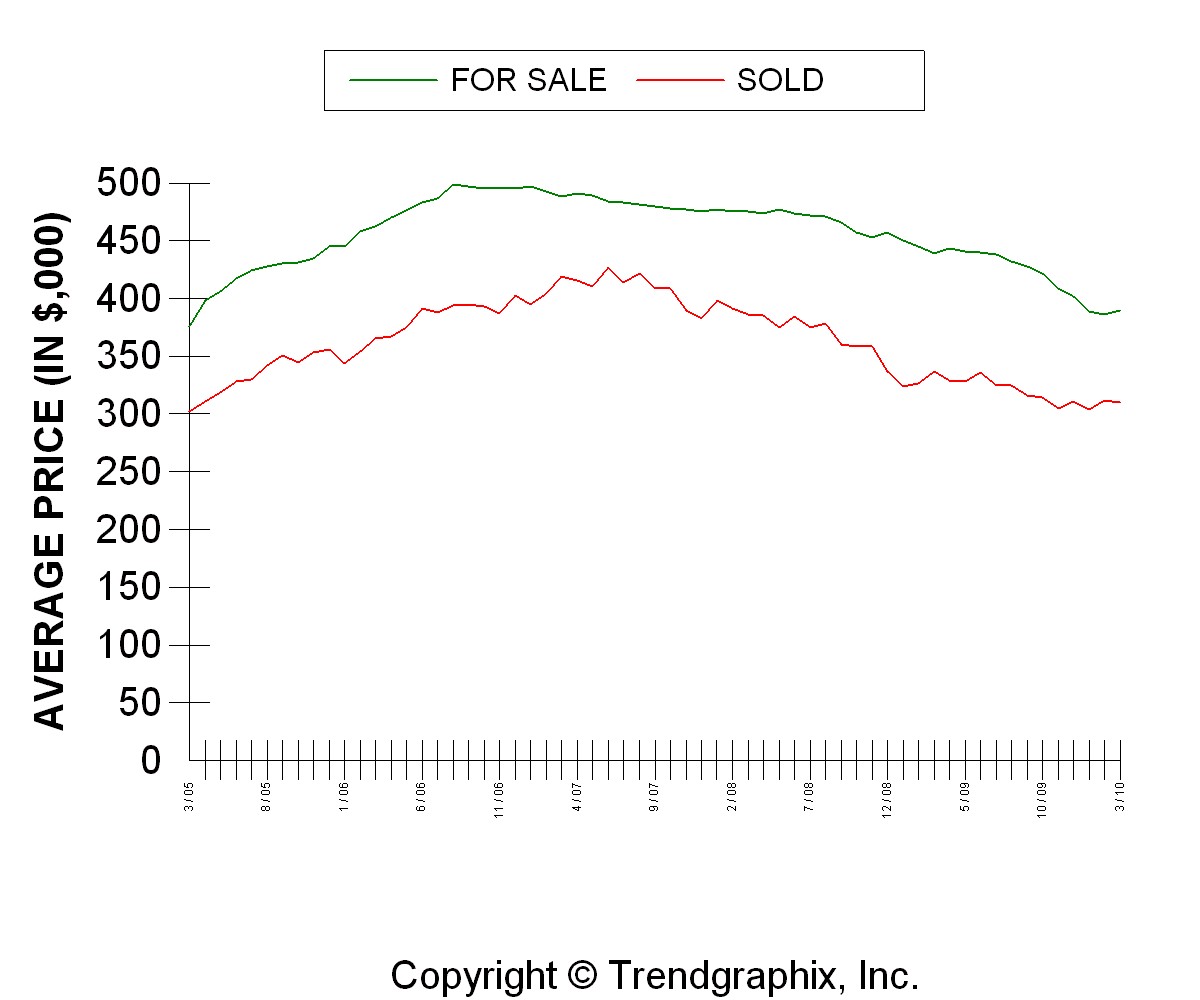
Finally, I will post 5 similar charts for Snohomish County. All the trends are essentially the same, except the prices are generally lower. Average prices are running at $310,000 and $151/sqft which is pretty flat compared with February, but down close to 8% from last March, and statistically pretty flat with March of 2005. So, prices have dropped a little more in Snohomish County than in King County and that's further reflected by the fact that they've decreased approximately 27-28% from the highs in 2007.


So, I hope that puts a little perspective on the market over the past half-decade. We're getting back to a more normal market where a home is just that- a home to live in first and long term investment second. I'm still very confident that owning real estate is a great investment over time, especially as the value of the dollar decreases with inflation. Just don't expect to be able to flip a home in 1 or 2 years with a 20% return…
