
 Facebook
 X
X
 Pinterest
 Copy Link
April stats are out and I'm going to recap King and Snohomish Counties combined. Every home and situation is different, but this will give you a general idea of what the numbers look like whether you're in north King County or south Snohomish County. As an aside, if you ever want charts or statistics for some other area of Western Washington, or if you want more detailed information for your city or zip code, just drop me an email and I'd be happy to email you a report.
April 30th was the deadline to get an agreed upon contract if you were trying to take advantage of the tax credit. It's been all the talk over the last couple of months and so now we will see how the market fares without this added support. There's no question that there was a rush of activity to beat that deadline and the pending sales figures show that. Pending sales were up 25.2% from March and 77.1% from last April. Interestingly, closed sales fell by 8.8% from March, but were still up 35.1% from last year. I am not sure whether that is due to sales failing or more due to the longer closing time needed for some lenders. I have not personally seen a larger systemic problem with failed sales so I suspect that it's more likely a lender processing time line issue more than anything else.

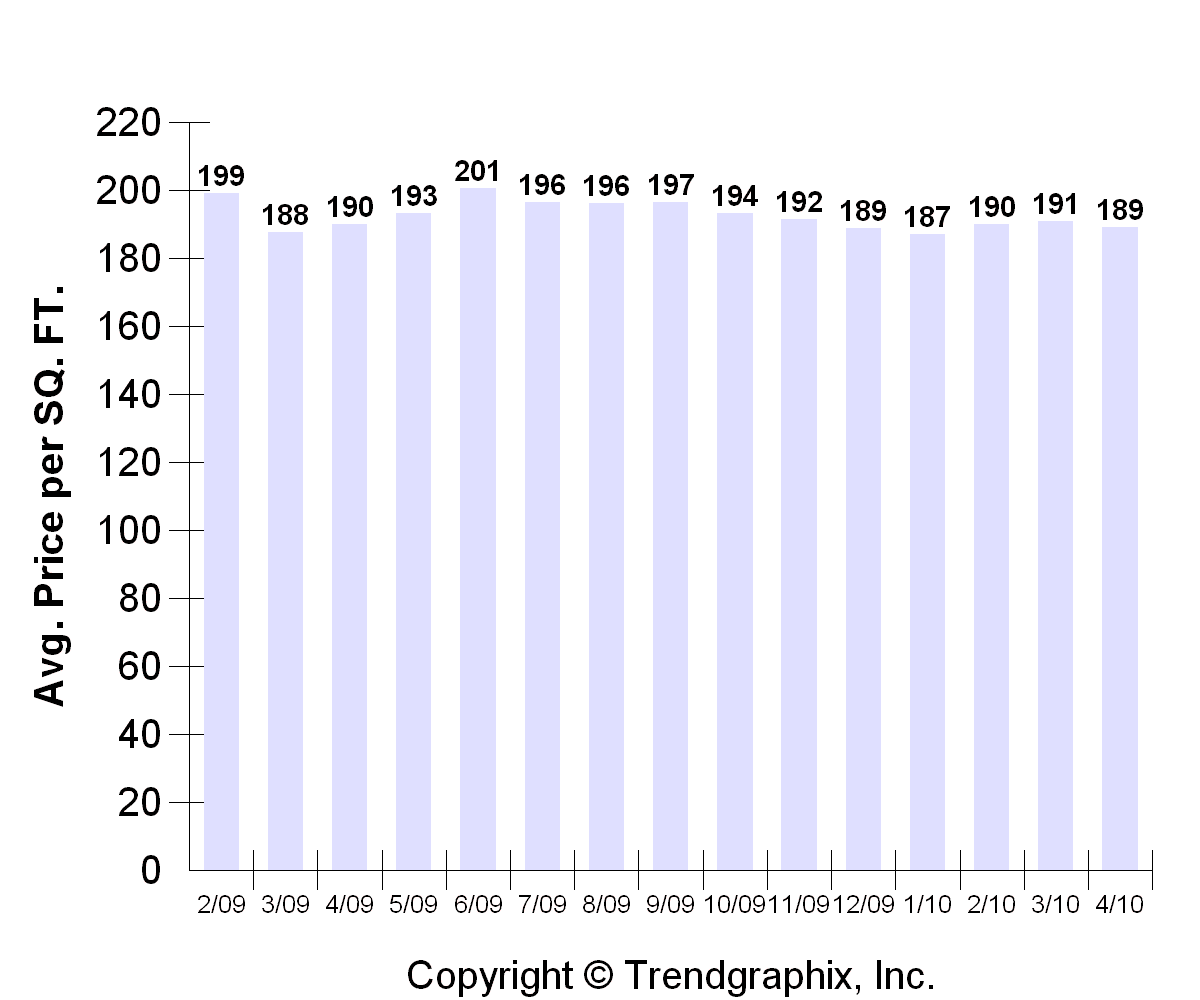
The next charts shows that the average sales price is $406,000 which is off 1.7% from March, but that is pretty much flat (-0.5%) from last April. The dollar per square foot price is at $189/sqft which is down -0.9% from March and down -0.4% from last year. Prices have basically been pretty flat over the entire past year, but it will be interesting to see if they soften at all, now that we have passed the tax credit deadline. Many of those properties haven't actually closed yet so it may not be until after June until we see the full effect, if any.

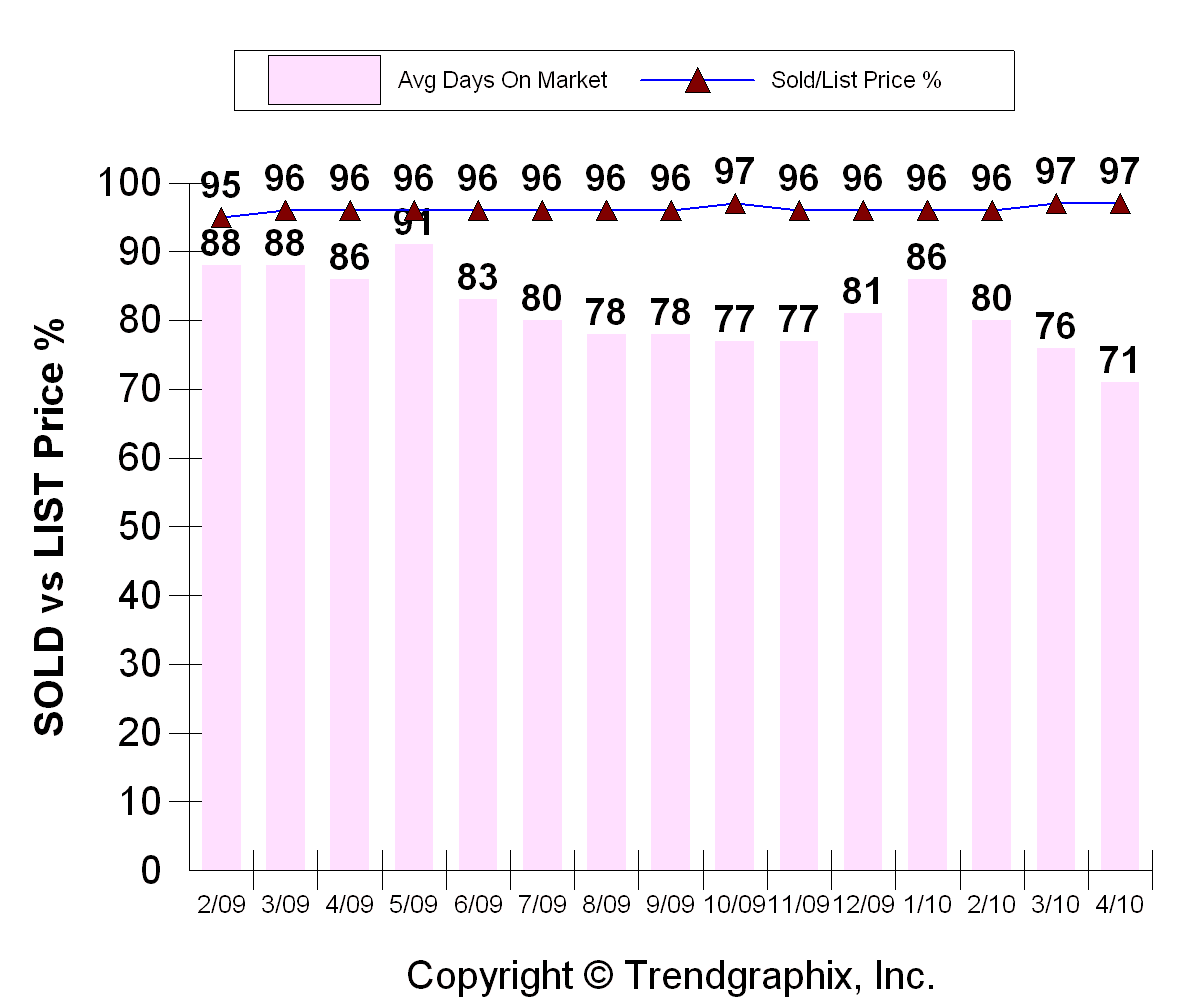
Average days on market fell to 71. Again, the aforementioned deadline undoubtedly helped there. And the sold vs. list price percentage held steady at 97%. Keep in mind that this is the percentage of the LAST listed price, which could already have been reduced once or many times.
Finally, this last chart shows the "Months of Inventory" which just gives an idea of how much inventory is out there compared to how much of that inventory is being sold every month. The lower the number, the more of a sellers market it is.

To summarize, the market has been doing pretty darn well. Given that the tax credit expired at this busiest time of year is probably a good thing as hopefully there will be enough demand out there to keep things going through the summer. Whether any of the future demand was pulled forward, only time will tell.
I know that we all can't schedule our lives around government stimulus programs, so when you need to make a move, just call a Realtor like me who's in touch with the housing market. I will then explain the current market in your neighborhood and come up with an appropriate plan of action to get you where you want to go in the time you want to get there.
