
 Facebook
 X
X
 Pinterest
 Copy Link
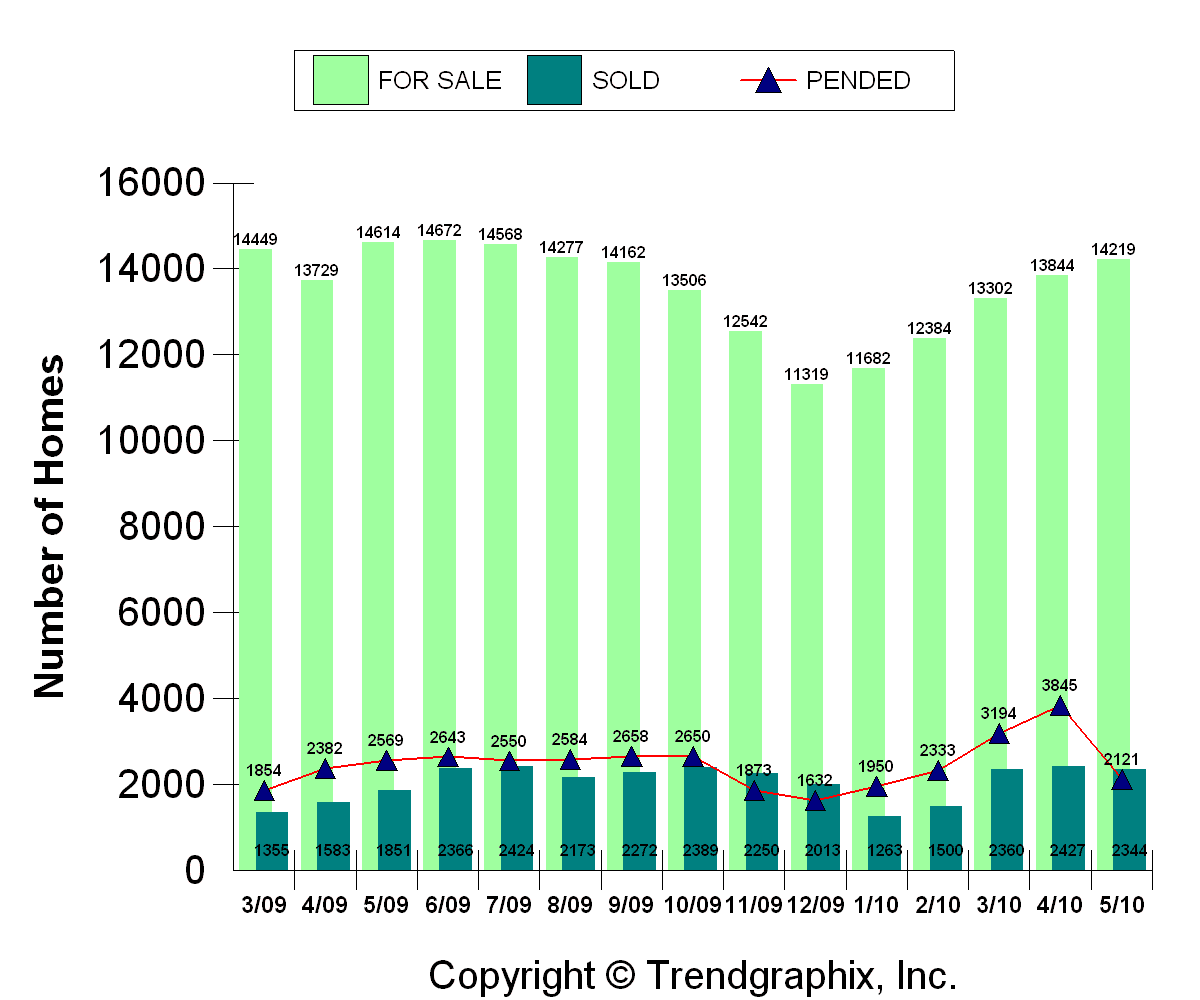
May stats are out and the immediate effects of the end of the tax credit are quite clear. Pending sales have been nearly cut in half from April. It shouldn't be shocking, but it is still a little disconcerting to see such a precipitous fall off at this time of the year. In a way, it's hard to read too much into it at this point because it was an artificial stimulus to begin with. It was pretty obvious a month ago, but it's even more obvious now, that some sales were pulled forward to take advantage of the credit. We'll probably see a couple months of lower than normal pending sales to make up for it. And hopefully it is just a month or two, not longer.
Delving a little more deeply into the numbers, you can see on the following chart, for King and Snohomish Counties, that while the pending sales dropped as I mentioned, the actual number of closed sales stayed pretty flat. That's because all those pending sales are now closing in May and June. Inventory did rise slightly which is normal for this time of year.
The next 2 charts show that the average sales price for closed transactions went up 2% from April to $415,000 in May. That is exactly the same as it was one year ago in May 2009. The dollar per square foot price jumped 3.6% from April to $197/sqft in May and that is up 1.9% from last year. Again, we are really going to have to keep an eye on prices and activity over the next few months to see how the market reacts to the end of the tax credit. Only once the effects of the credit are finished filtering through the system will we really be able to see how Mr. Market is doing on its own.


Here is a chart showing the average CONSECUTIVE Days on Market (CDOM) and the Selling Price as a percentage of the ORIGINAL List Price (SP/Orig LP%). This is a little different from my chart last month that only showed the days on market and sales price essentially from only the last listing period. Currently, the CDOM dropped to 92 days after being at over a hundred for a long time. I'm sure that's due to the tax credit and I wouldn't be surprised to see that pop back up next month. You can also see that the sales price as a percentage of the original list price is at 93%. The percentage becomes 97% if you look at it versus the LAST listed price.
What you can take away from this is that if your home is in good shape and you are priced right, you will get a higher percentage of your asking price and it will not take as long to sell. But, many homes go on the market at the wrong price and aren't in great shape, and therefore they can spend months getting "stagnant" on the market and inevitably getting less than they could have if they were priced right from the beginning.

Finally, here's a chart of the Months of Inventory based on closed sales. This range we are in now should give us a relatively stable market, but if you look at it based on Pending Sales, there is a decent spike at the end which brings it back up to the top of the recent range. I'll keep an close eye on that to see what happens as we filter out all the additional tax credit sales.

To summarize, there is no question that the tax credit had an affect on sales going into the end of April. How many sales were pulled forward from May, June, or later months, still remains to be seen. But, the only way we're going to see how stable the market really is, is to get rid of the artificial stimuli. We need to let the inventory clear on its own and let people make purchasing and sales decisions, not based on a random time line given to them by the government, but rather make those decisions based on natural market forces and on their own time lines.
