
 Facebook
 X
X
 Pinterest
 Copy Link
July stats are out and it's a little bit of a mixed bag as far as the data goes. I'm posting 5 year charts to give a little perspective on what's happened over the last half-decade but I will zero in on the past year or so.
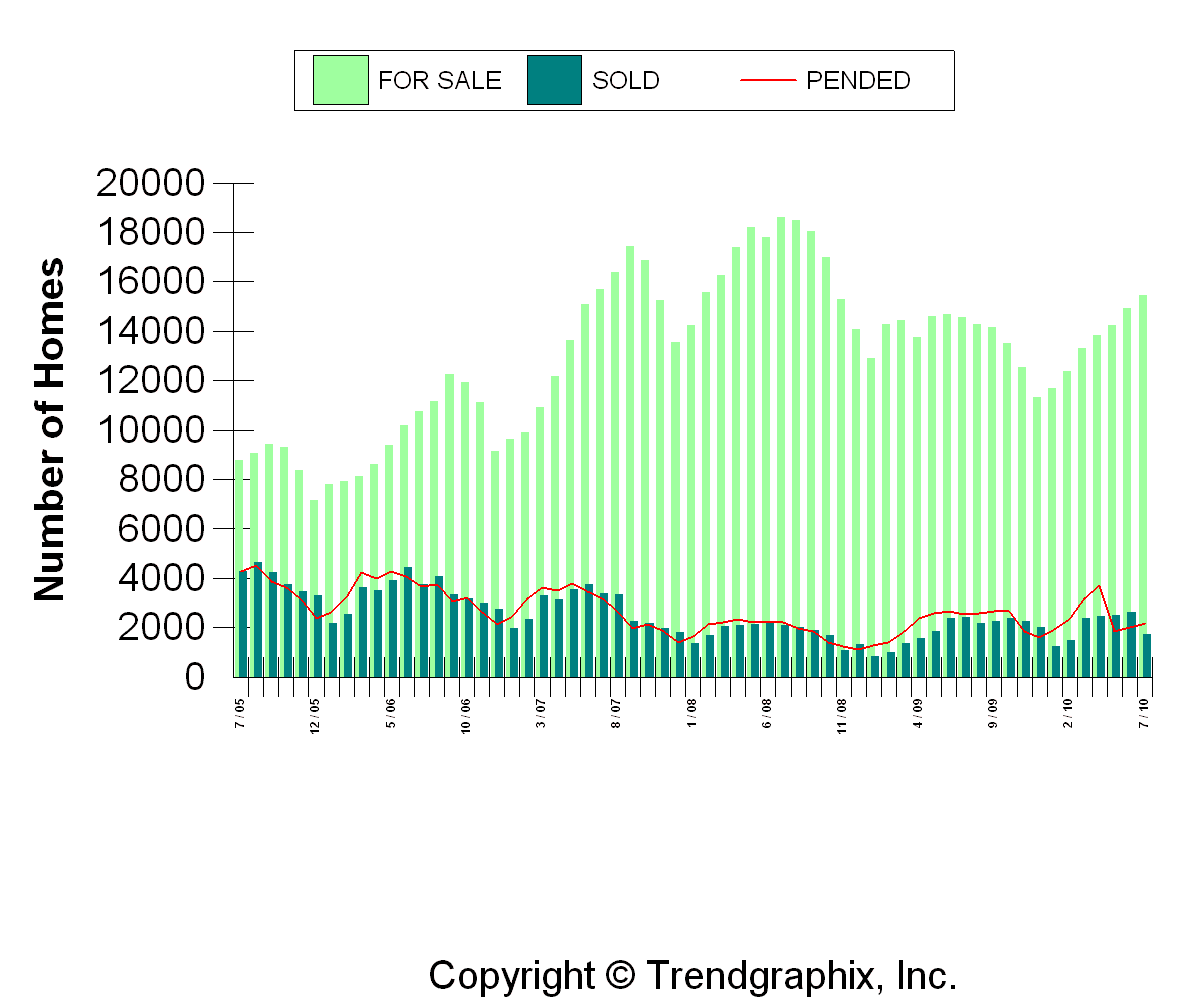
Inventory is up since June and it is also higher than last year at this time. Pending sales have increased 8.5% over June but are down almost 28% since last July. Sold (closed) homes have decreased 33% since June and are also down 13.8% from last July. Basically, the increase in pending sales is positive, but the decline in closed sales and the increase in active listings are both negative.
I mentioned that the data was a bit of a mixed bag and to further that thought even more is that average sales prices in our area actually edged up 4.2% over June and are 6.6% higher than last year at this time. I would have expected them to hold steady or even possibly decline a little, if for no other reason than there is simply more competition between active listings.
For King and Snohomish Counties combined, the average sales price in July was $451,000 and an average of $199 per square foot.


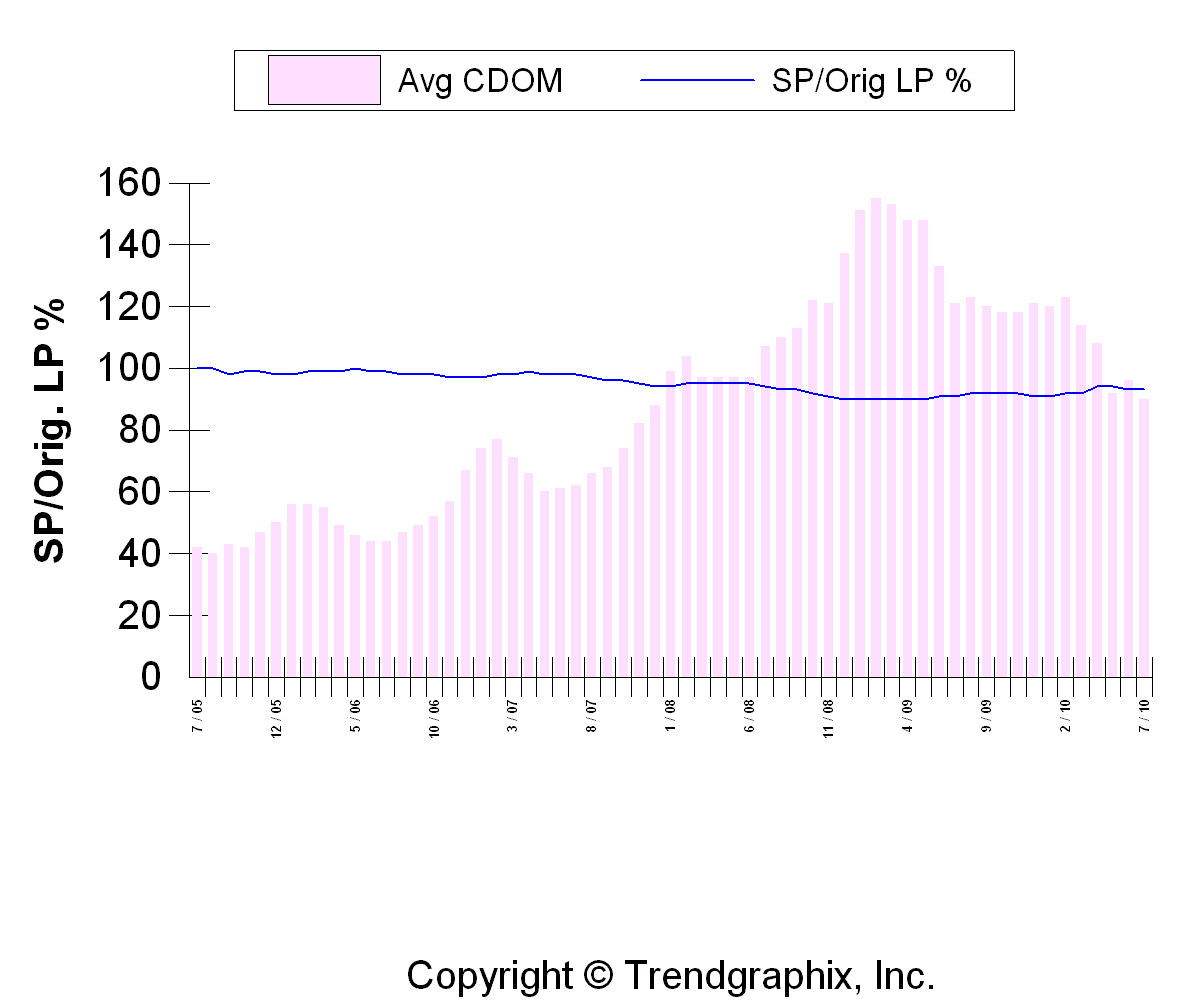
Average Consecutive Days on Market declined 6.2% from June to 90 days. That is a little surprising to me since we do have more inventory while at the same time, closed sales declined. Pending sales did rise a little bit but I don't think it was enough to significantly decrease the days on market. It's possible that some sellers have "given up" and let their listings expire because either they're underwater and "can't" sell for enough to break even or it no longer makes sense to sell at this price or at this time.
Also, you can see that the Sold Price as a percentage of the Original List price is holding steady at 93%. I've mentioned this before, but if you'll notice back in the frenzied seller's market of '05, that stat was 100%…
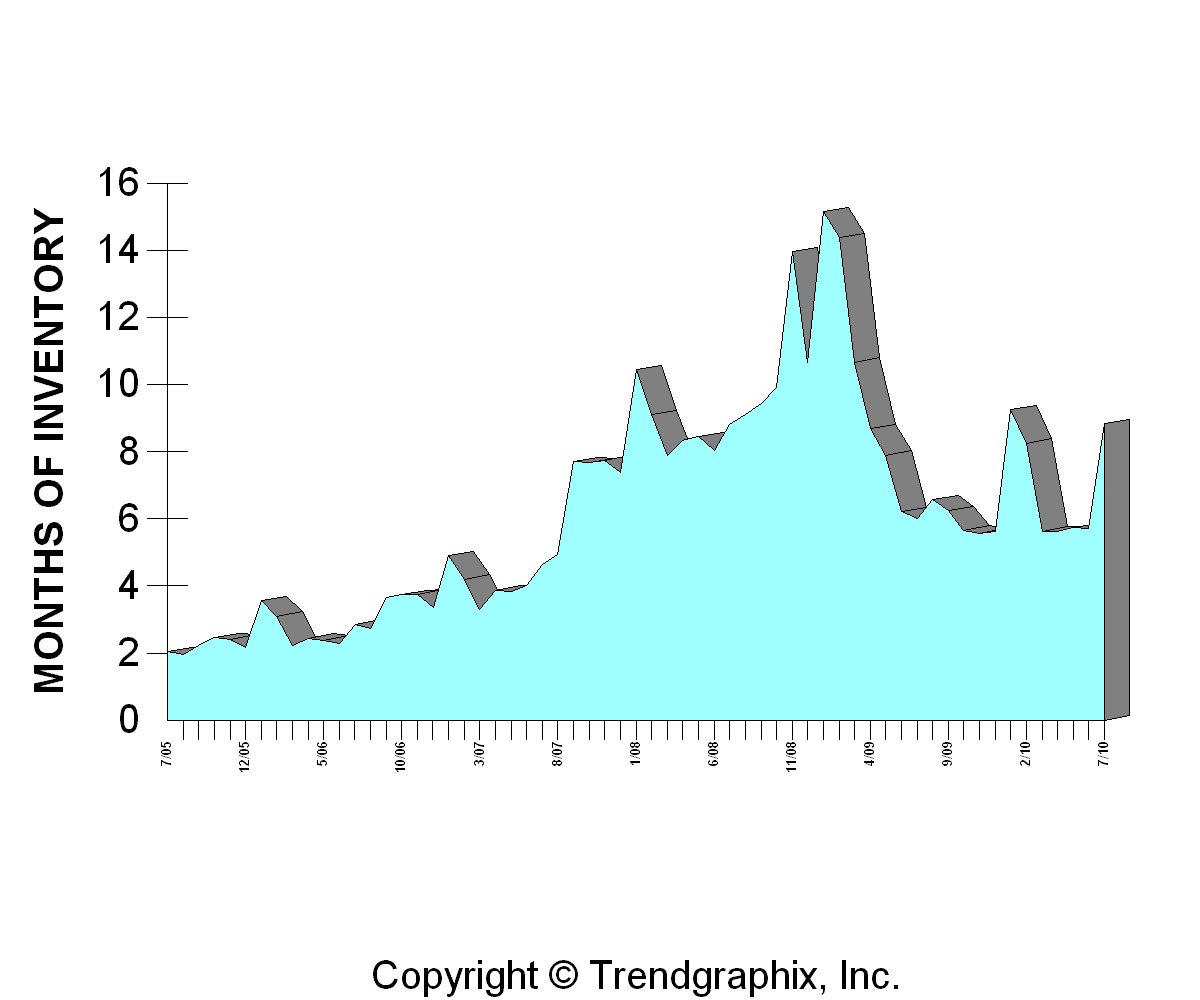
Months of inventory has spiked up to 8.8 months. That is higher than what I would like to see, but it is likely to decrease as we head into the fall months, when buyers start making their purchases before the end of the year.
To summarize, my interpretation of the data tells me that the current market is in a sideways and choppy trend. It's a mixed bag with pluses: increasing prices, increasing pending sales, steady days on market -and minuses: increase in inventory, fewer closed sales. But, those pluses are very good things and not necessarily expected. So, we could get another month of mixed data from August, as it tends to continue to be one of the slower summer months. But hopefully, buying activity will pick up again like it often does come September when many people start to make their fall moving plans. With historically low interest rates and a plethora of homes to choose from, the question isn't whether it's the right time to buy, it's how do I choose between all the great choices. 🙂
