Happy New Year! This month, I would like to give a perspective of King County real estate activity over the last 5 years…
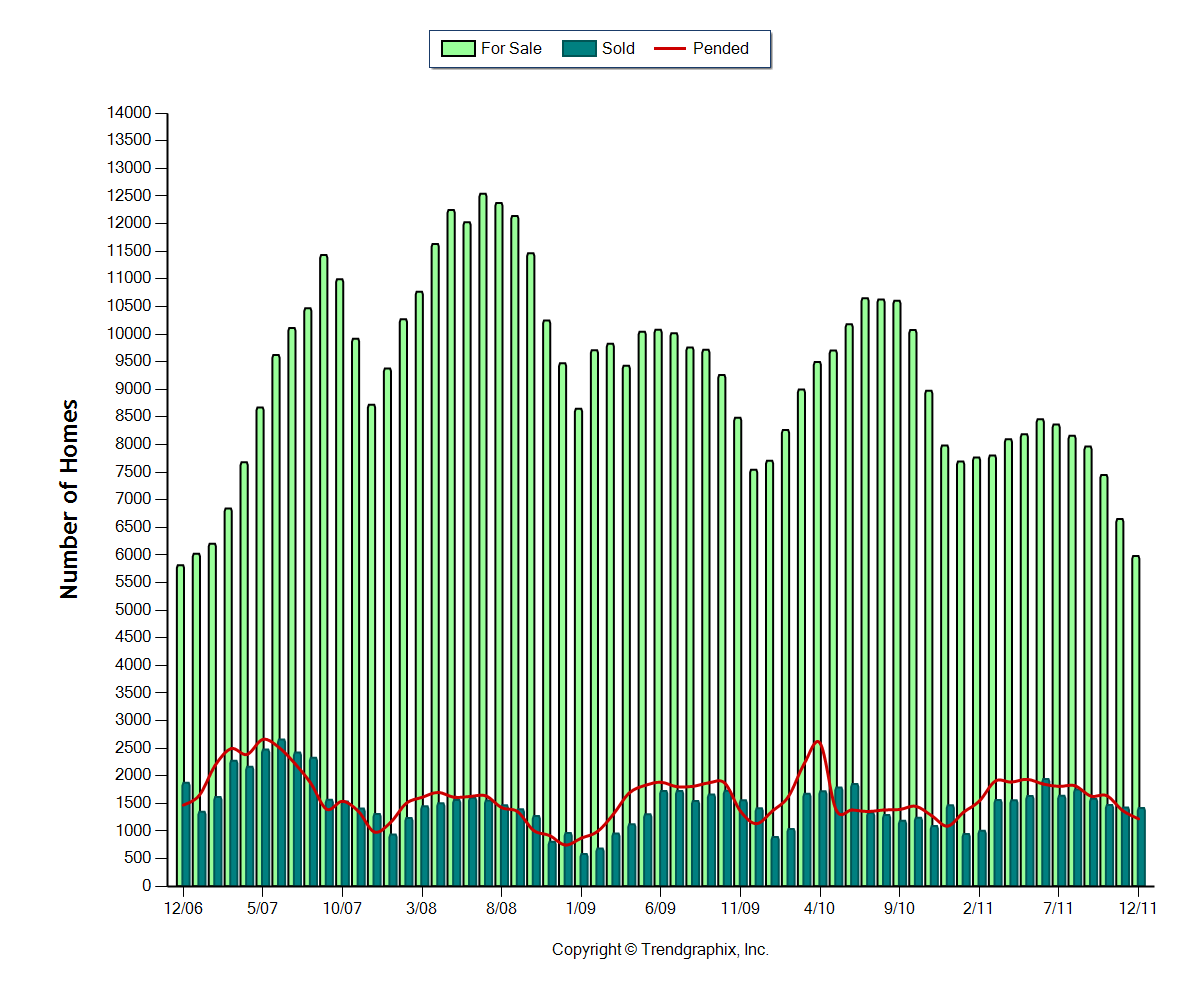
If you recall, at the end of 2006 and at the beginning of 2007, the housing market was starting to shudder a bit in other parts of the country, but things were still going pretty strong in the Seattle area. That spring of 2007 was very busy and prices and sales topped out in the middle of that year. The number of sales started to decline after June 2007 but the inventory kept ballooning to new heights until the middle of 2008. Inventory remained elevated through 2009 and most of 2010. Inventory in 2011 actually remained relatively low throughout the entire year and especially as we hit the end of the year.
Looking back to December 2006, we had almost exactly the same amount of active homes for sale as we did last month. But, the number of Pending sales has declined 17% and the number of sold properties has declined 24% since then. While that doesn’t sound great, Pending and Closed sales are up over 2010 levels so the market seems to be trying to find a base.
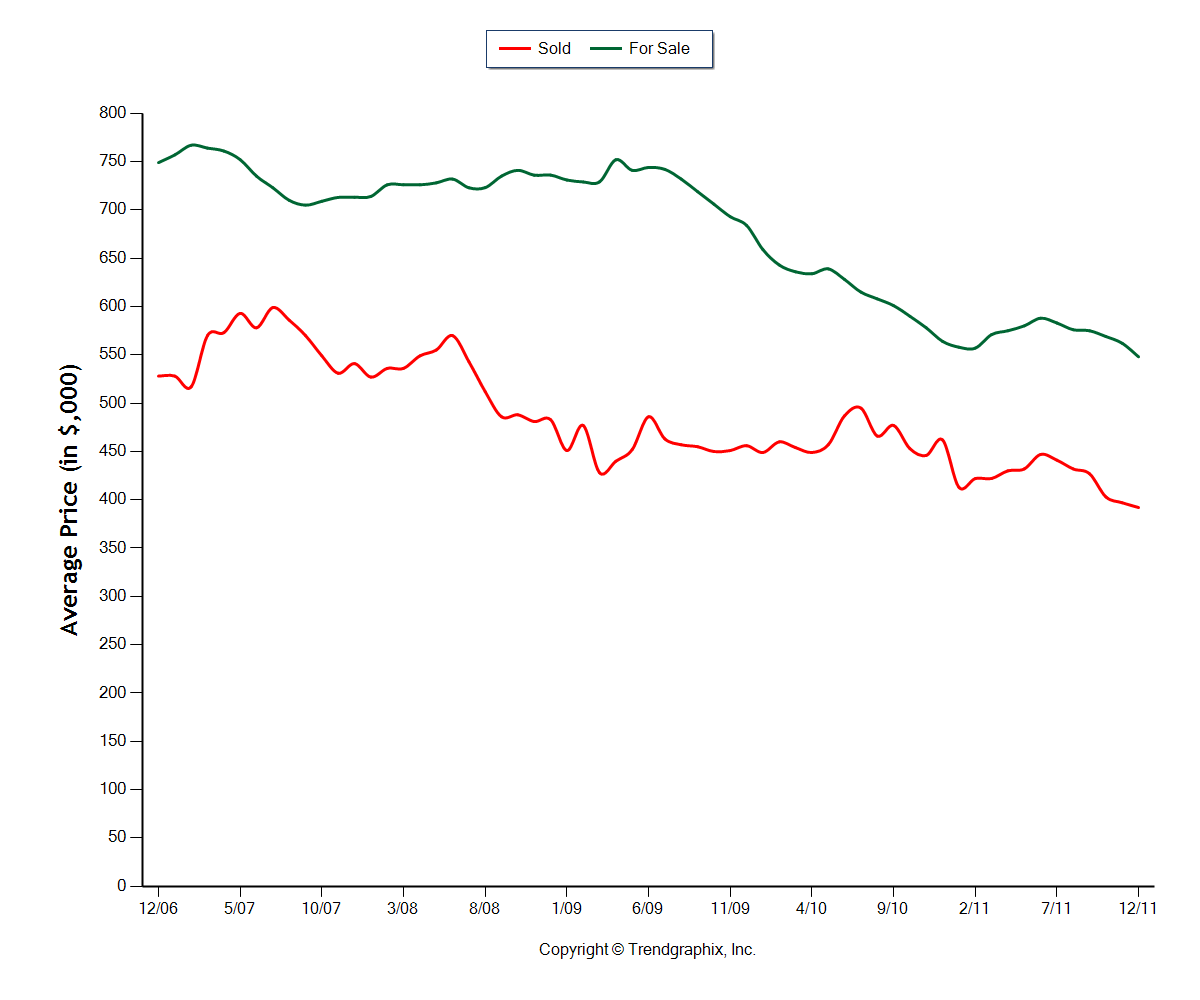
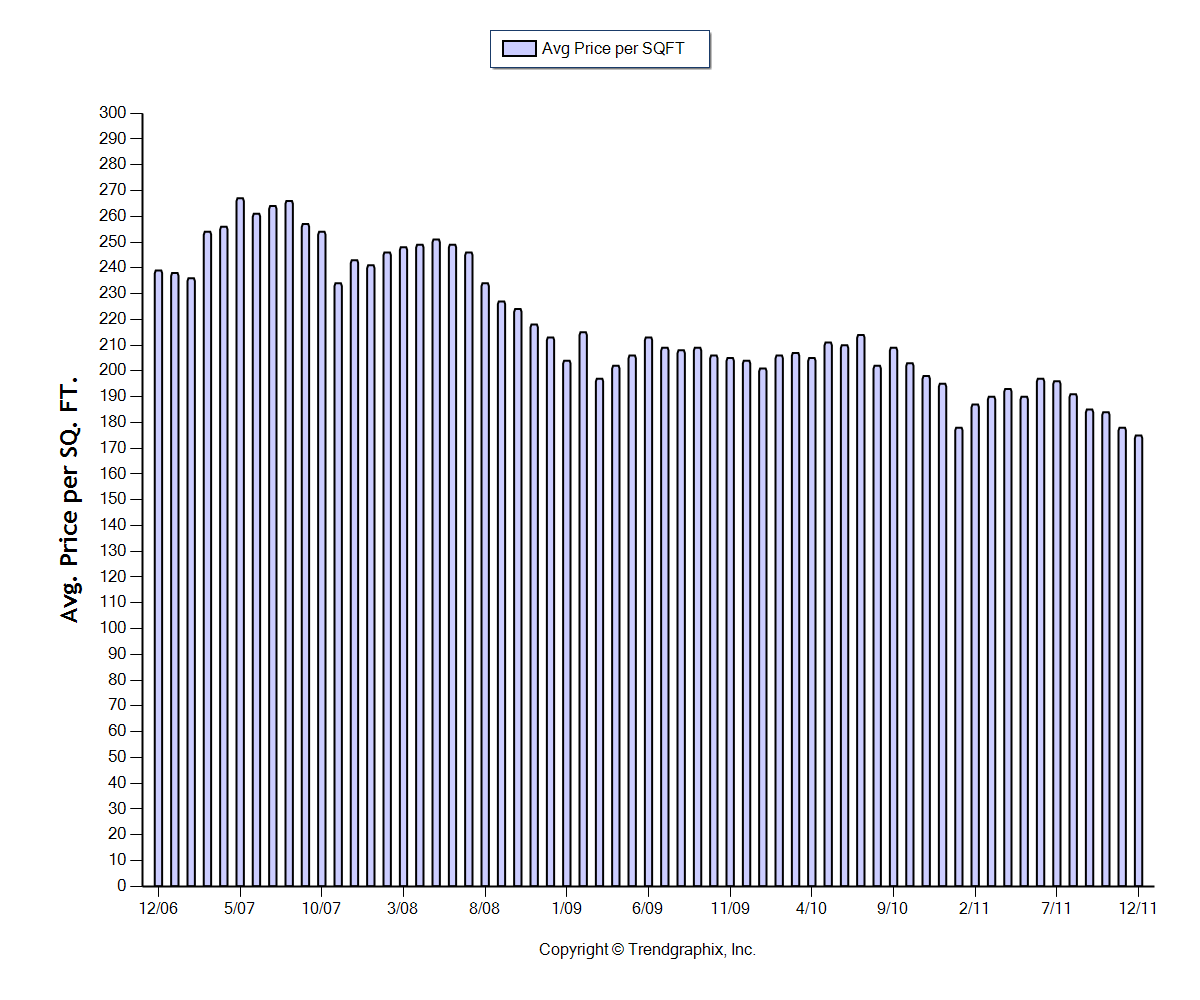
As far as prices go, in King County we peaked out in July 2007 at an average sales price of $599,000. Average dollar per square foot reached it’s top in May 2007 at $267/sqft. Last month, the average sales price was $392,000 and $175/sqft. That is a decline of a little over 34%. While we are essentially at new lows since the peak, part of the softness in pricing may be seasonal so I would suspect at least a little rebound as we head into spring and summer.
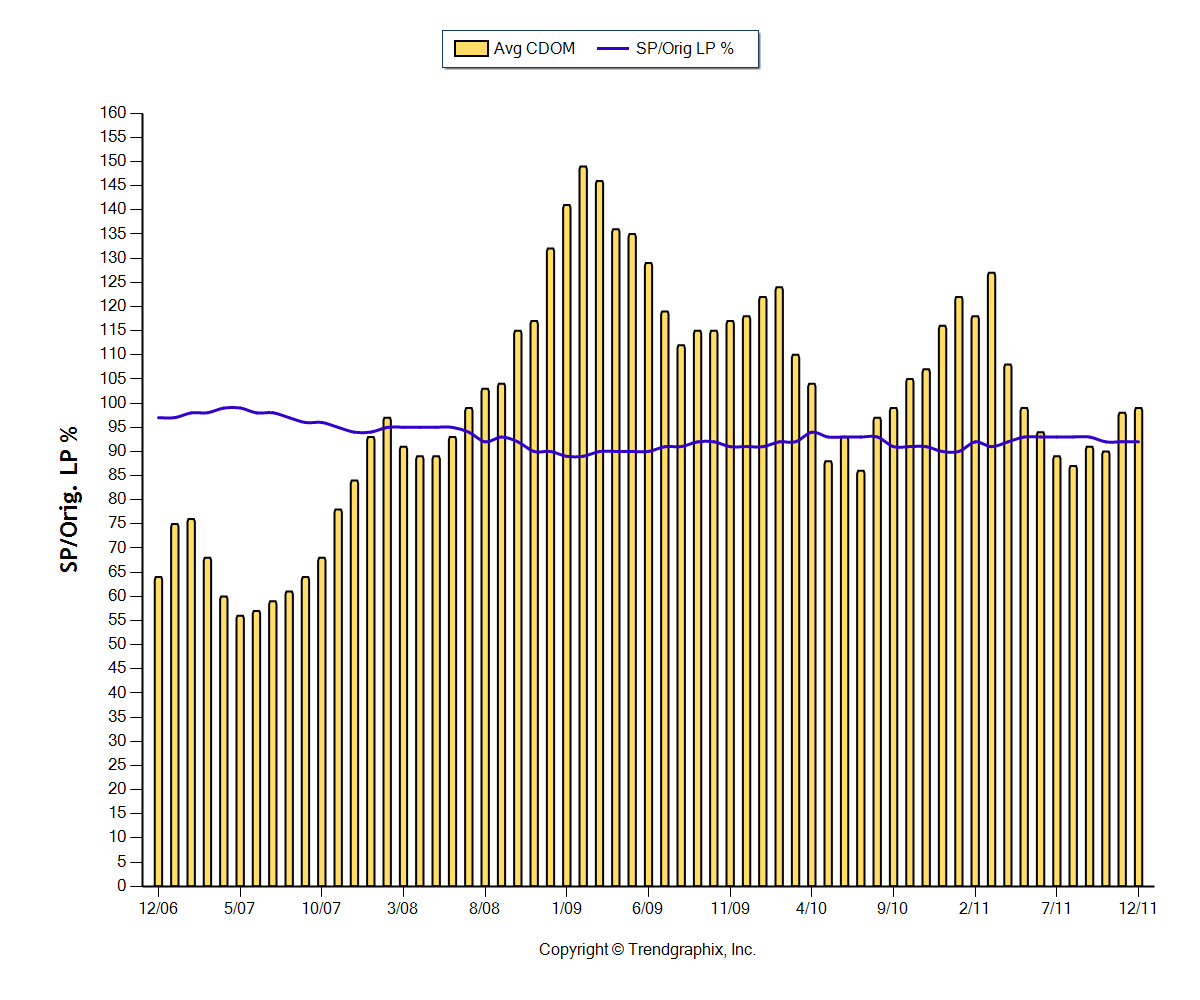
Another interesting market dynamic is to look at the ‘Average Days on Market’ and the ‘Sales Price as a Percentage of the List Price.’ In December 2006, we were averaging 64 days on the market. Last month, it was 99 days, or a 54% increase. Also, in December 2006, sales prices were averaging 97% of the Original List Price. Last month, homes were selling on average at 92% of the Original List Price.
Finally, after a wild ride up in late 2008 into 2009, the inventory of active homes for sale has come back down to pre-crisis levels. In December 2006, there was 3.1 months of inventory and last month there was 4.2 months of inventory. I can’t stress enough how important a modest amount of homes for sale is for a healthy market. It’s good old fashioned supply and demand. In the boom years in 2005/2006, there was a ton of demand and very little supply, and then in the bust years, there was huge supply but little demand. Now we are back to modest supply and modest demand which I think is a perfect recipe for securing a base from which prices and activity can grow.
January has started off with a bang with busy open houses and buyers resolving to get off the fence. I expect this to be a busy spring and another decent year overall with a slight increase in activity over 2011 and even a slight increase in prices. That’s just a best guess on my part but I think the housing market now has the wind at its back given that we have a slightly better economy and job market and there is the desire for politicians to “not rock the boat” in an election year. Top that off with a little inflation and I believe the market will be in better shape come 2013.
*Statistics not compiled nor published by the NWMLS
 Facebook
 X
X
 Pinterest
 Copy Link


