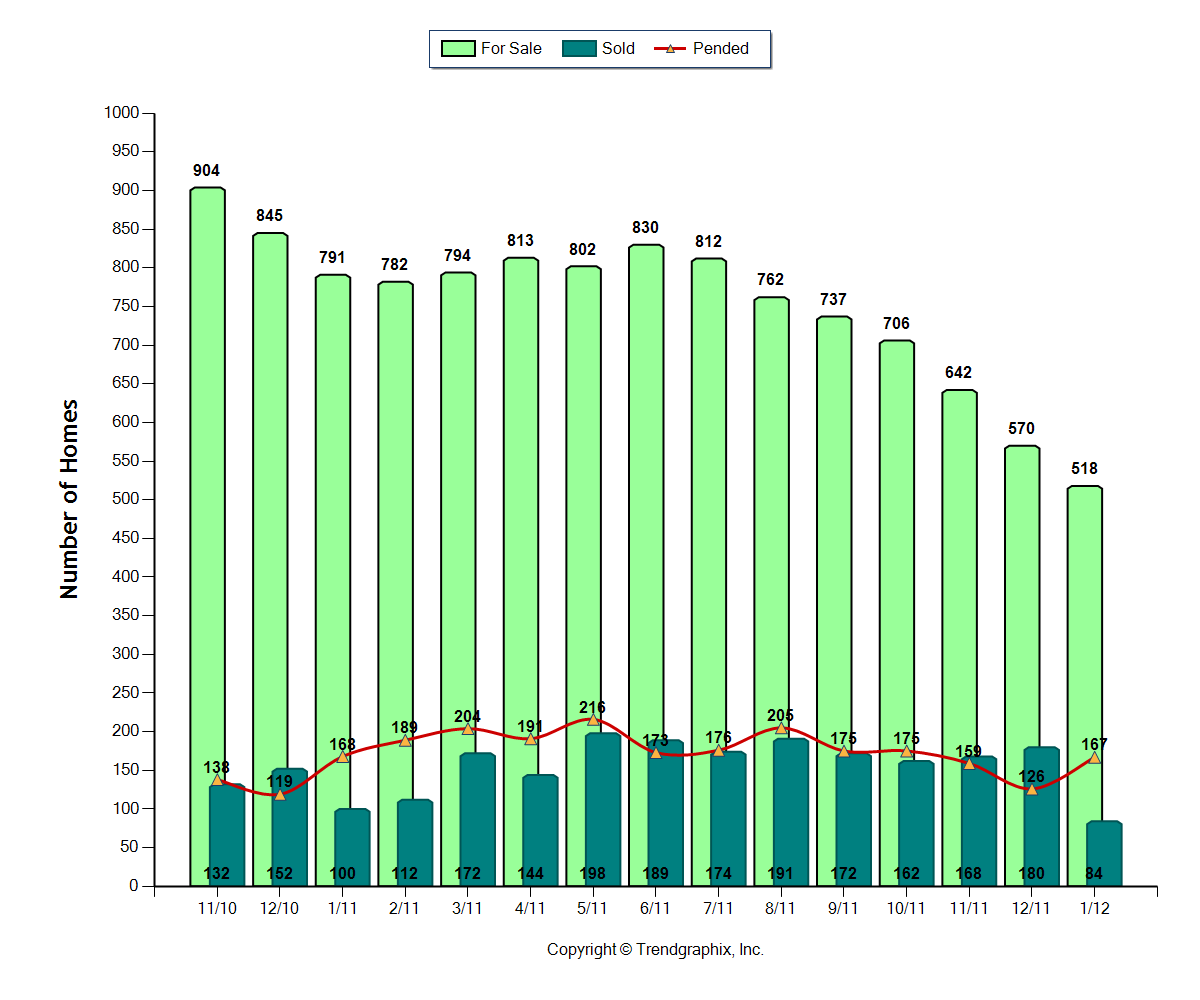
January housing market stats are out so let’s do a little recap and analysis of housing market activity in North King County. The charts below include statistics for the cities of Shoreline, Lake Forest Park, Kenmore, and the King County part of Bothell. This first graph shows the active homes for sale in light green, the homes under contract (pending) as the red line, and closed sales in blue. You can see quite clearly that the inventory of available homes is the lowest it’s been in a long time. Part of that is due to the time of year and it will be natural for more homes to come on the market as we get closer to spring. But even with the lower inventory, pending sales increased quite dramatically in January. That tells me there is some pent up demand from buyers and they are out there taking advantage of historically low interest rates and lower prices. A relatively small number of sales closed in January but that’s not too unusual because fewer people are making offers in December. The pending sales line should precede closed sales by 1-2 months so it is a leading indicator of sales that will close in February and March.
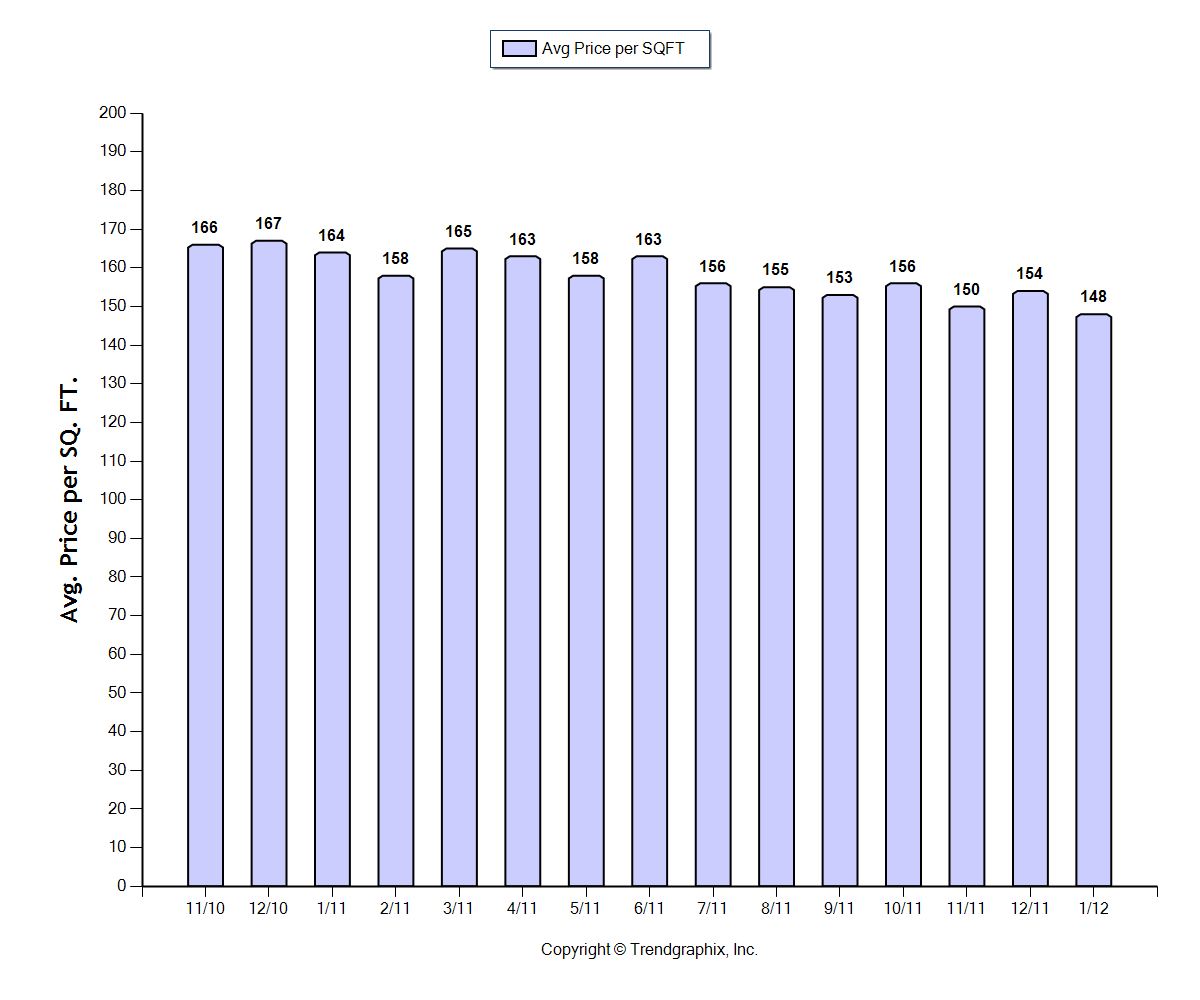
Now let’s look at prices. The average sales price for this north end of King County last month was $342,000 and $148/sqft. That is down about 10% from January 2011. BUT, I really don’t feel like you can say that all homes lost that much value last year. I believe that a lot this last year’s overall price decline is attributed to the fact that a higher percentage of lower priced homes sold. If you look just at homes priced between $300,000 and $600,000 in this same area, average prices actually increased slightly!
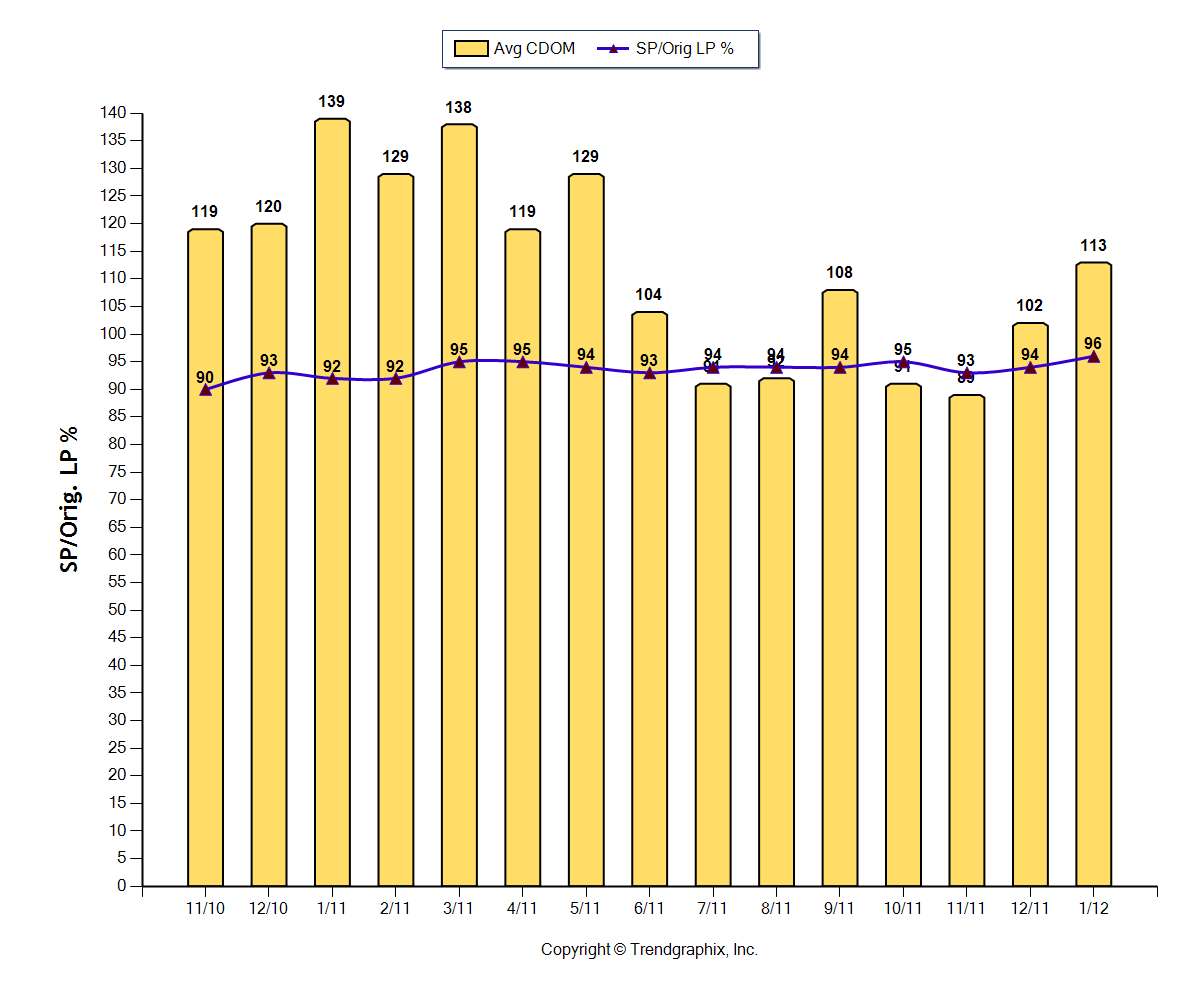
Average consecutive days on market increased to 113 from 102 days in December. But, we were at 139 days last January. And it’s very encouraging to see that the sales price, as a percentage of the listing price, increased to 96% from 94% in December and from 92% last January.
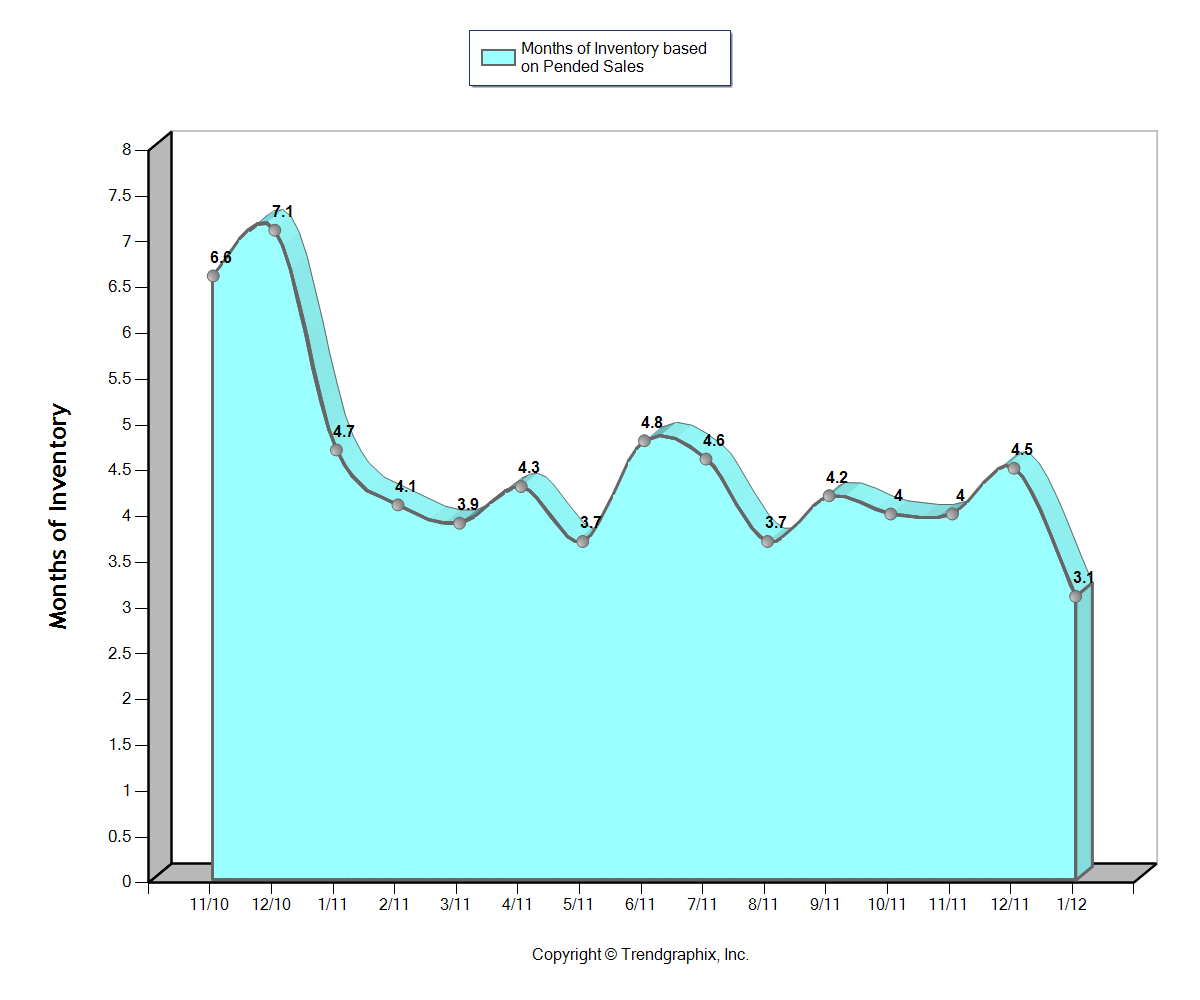
Finally, another measurement of the low inventory is shown in this Months of Inventory chart. We are at only 3.1 months of inventory based on Pending sales. Most of last year was very healthy in the 3.7 to 4.8 range. Getting under 3 months of inventory would basically be a sellers market while 3-6 months is a balanced market and above 6 would be a buyers market. Of course, every price range is different so there is definitely more demand in certain areas and prices than in others.
Real estate markets are extremely local so every house and neighborhood is unique. Use these trends as a guideline, but at the point you are thinking about selling your home, or if you find a new home that you think you want to buy, consult with a Realtor who knows your area who can assess the property, the neighborhood, and your specific situation.
*Statistics not compiled nor published by the NWMLS
 Facebook
 X
X
 Pinterest
 Copy Link


