Summertime Melt-up?
I hope everyone enjoyed our beautiful Pacific Northwest summer! While I've been able to enjoy some of it myself, I've also stayed very busy as the housing market continued to be strong over these past two months. I thought it might be a good time for a market update so below you will find a few data charts for King and Snohomish Counties combined. These charts are a good representation of what's going on in north King and south Snohomish Counties including cities like Lake Forest Park, Kenmore, Shoreline, Bothell, Brier, Mountlake Terrace, and Edmonds.
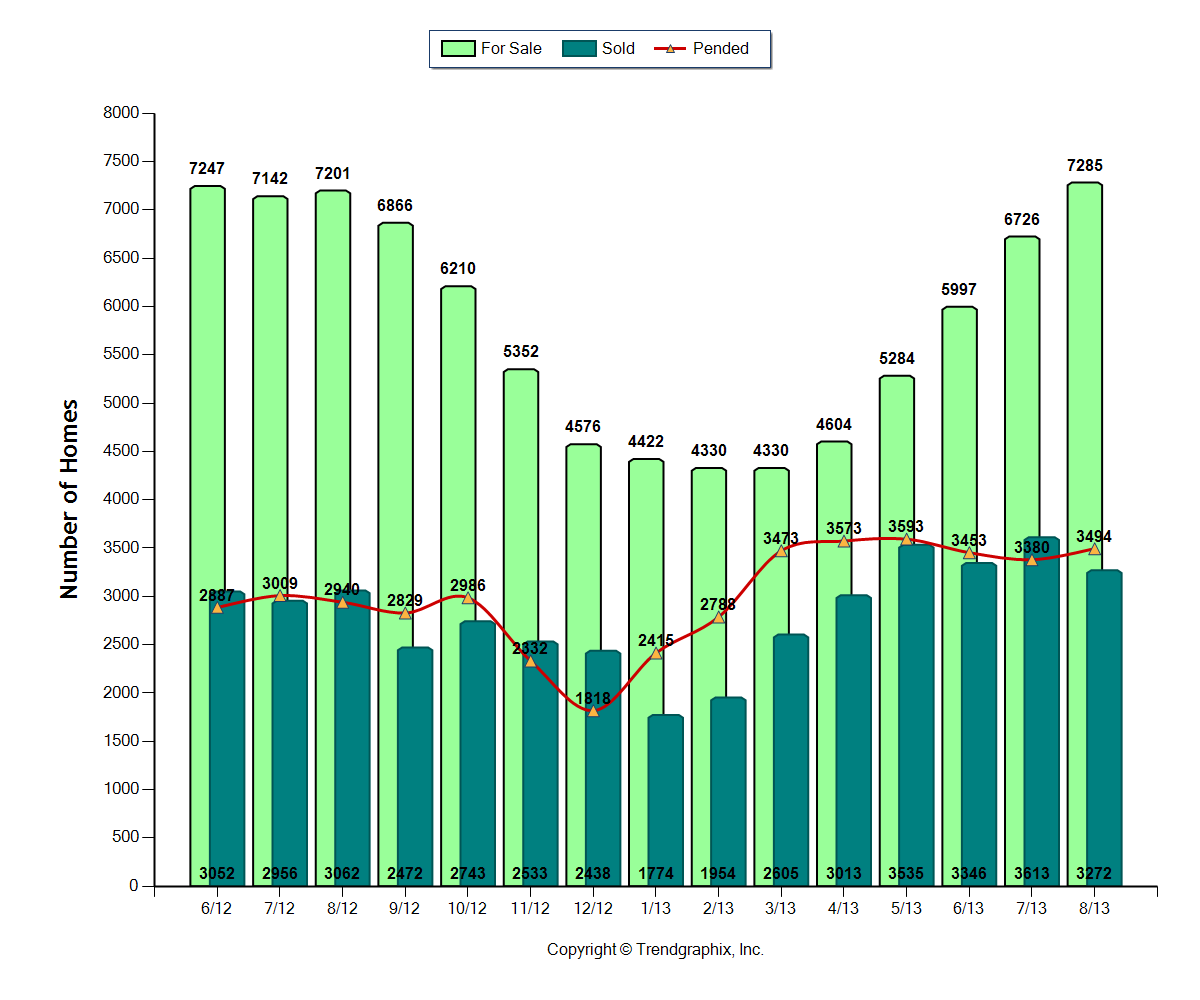
The inventory of active homes for sale is finally higher than at any point last spring or summer. However, it is still historically low at only 2.2 "months of inventory" which means it technically remains a seller's market. New listings and closed sales fell off a bit compared with July, but pending sales (homes placed under contract) did increase slightly from last month.
This graph shows the pop up in months of inventory to back over 2 months. Will it stay there or fall back down like it did last year going into the fall months?
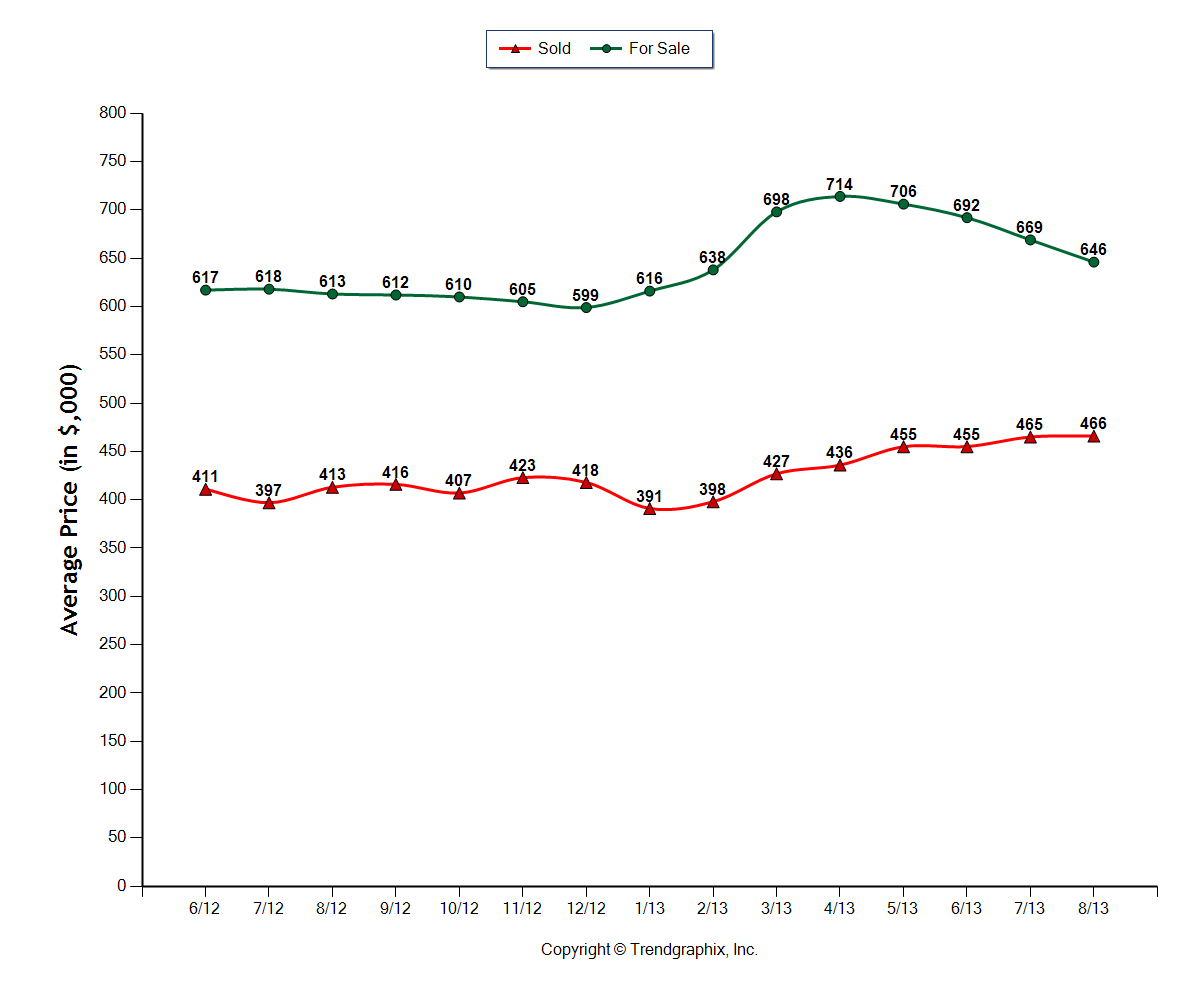
Sold prices have appreciated very slightly from July to an Average of $466,000. This is up 12.8% compared to last August. More interesting is that the average Active asking price is coming down into more reasonable territory after a somewhat irrational exuberance by some sellers in the spring.
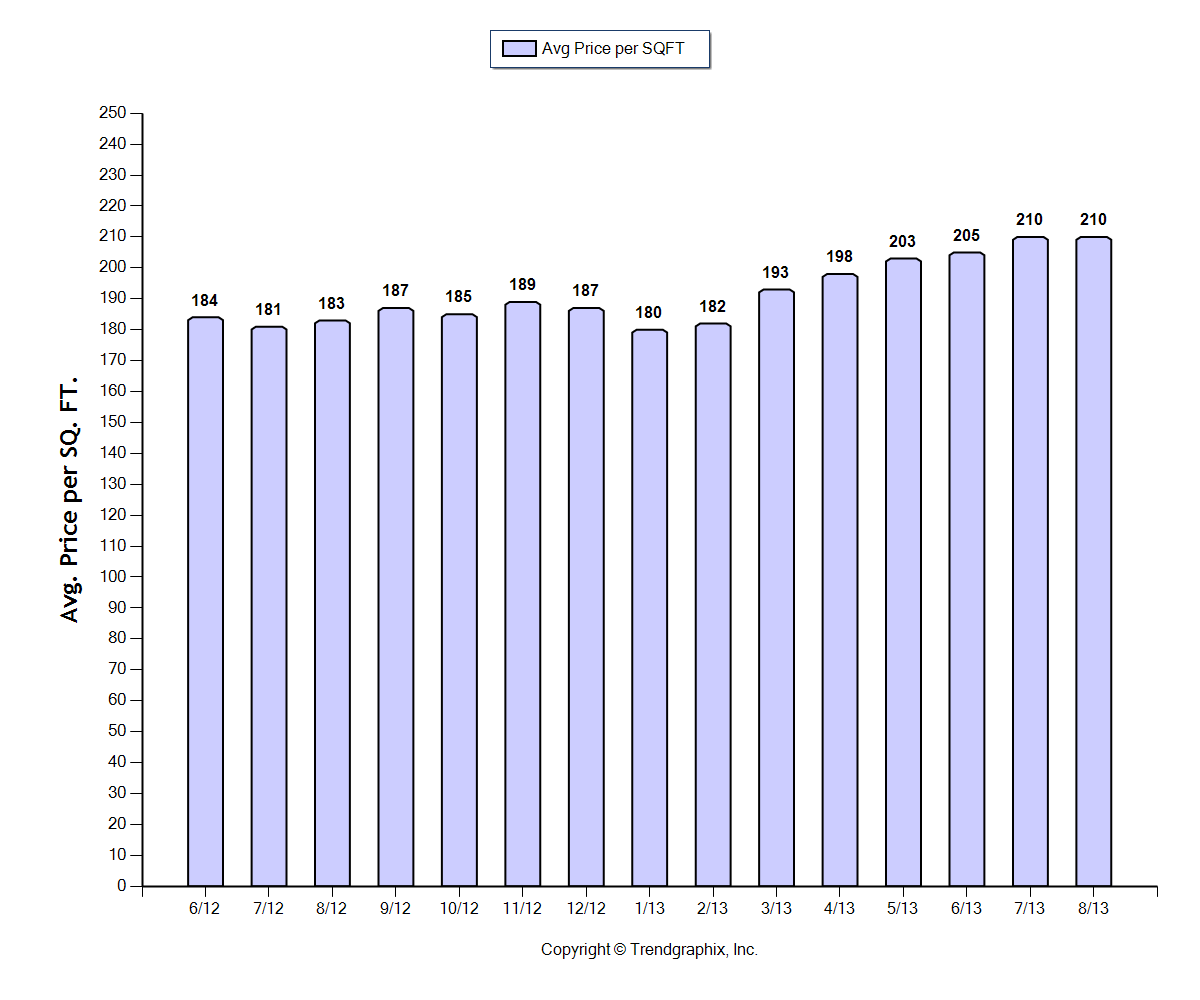
The average dollar per square foot value held basically flat since last month at $210/sqft.
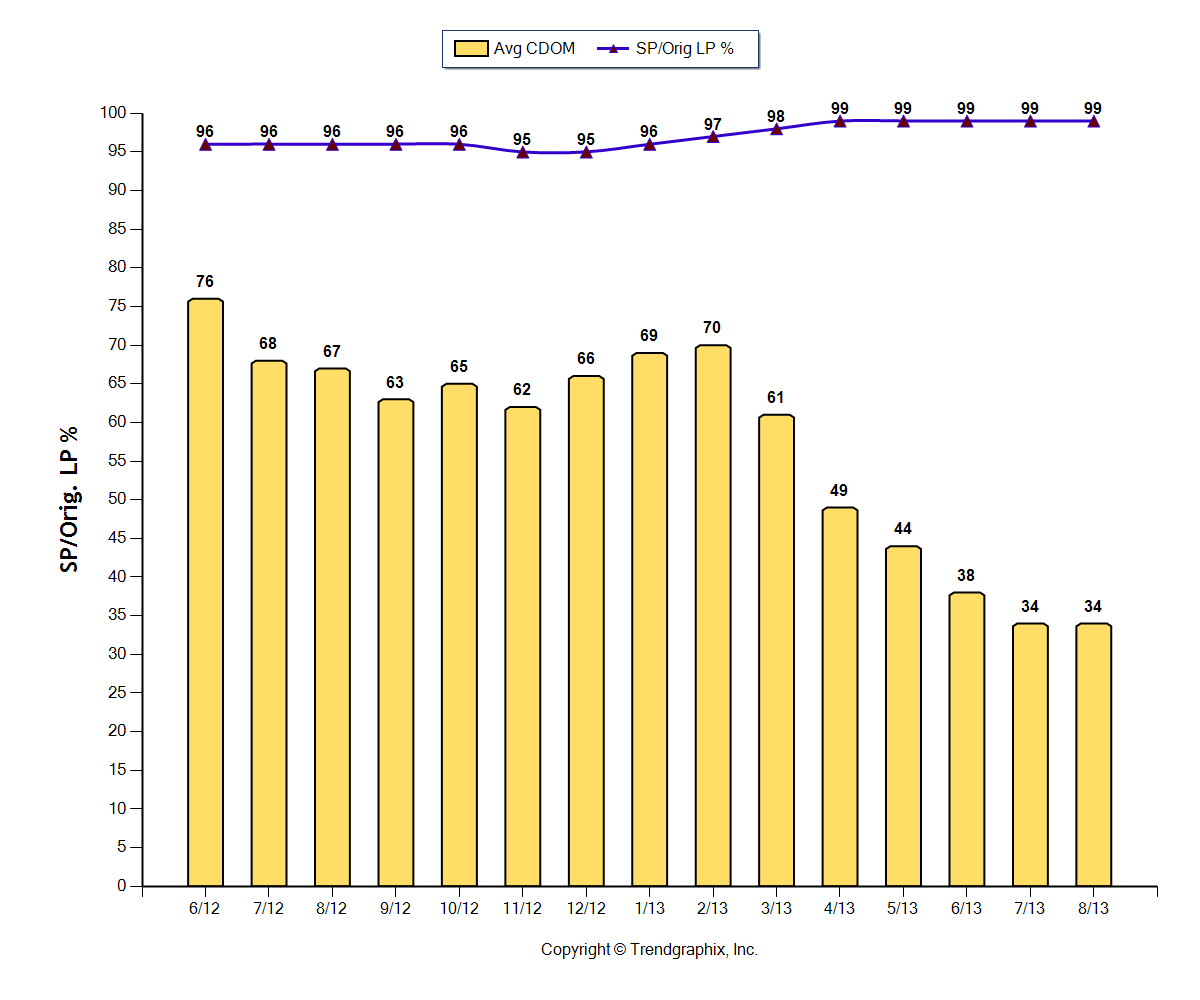
The average selling price as a percentage of the original listing price is holding steady at 99%. There are still many multiple offer situations but that trend is cooling a bit.
The average consecutive days on market remains steady as well at 34 days.
To conclude, the market is still very strong, although it did level off in the late summer. The early fall months typically bring a new crop of buyers and sellers out who want to make a move before the holidays and the end of the year. It'll be interesting to see if that trend holds true once more. Stay tuned!
Rational Exuberance?
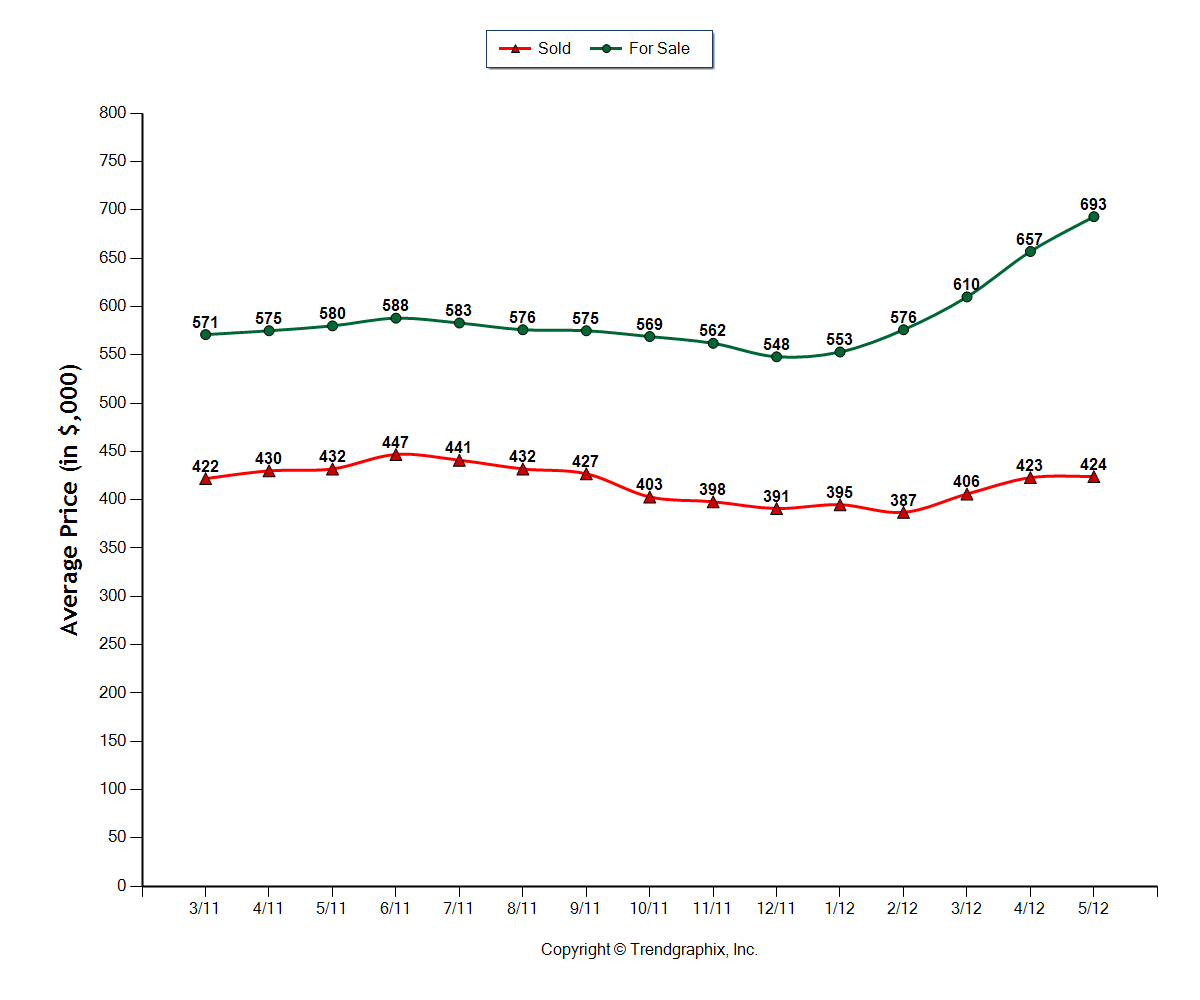
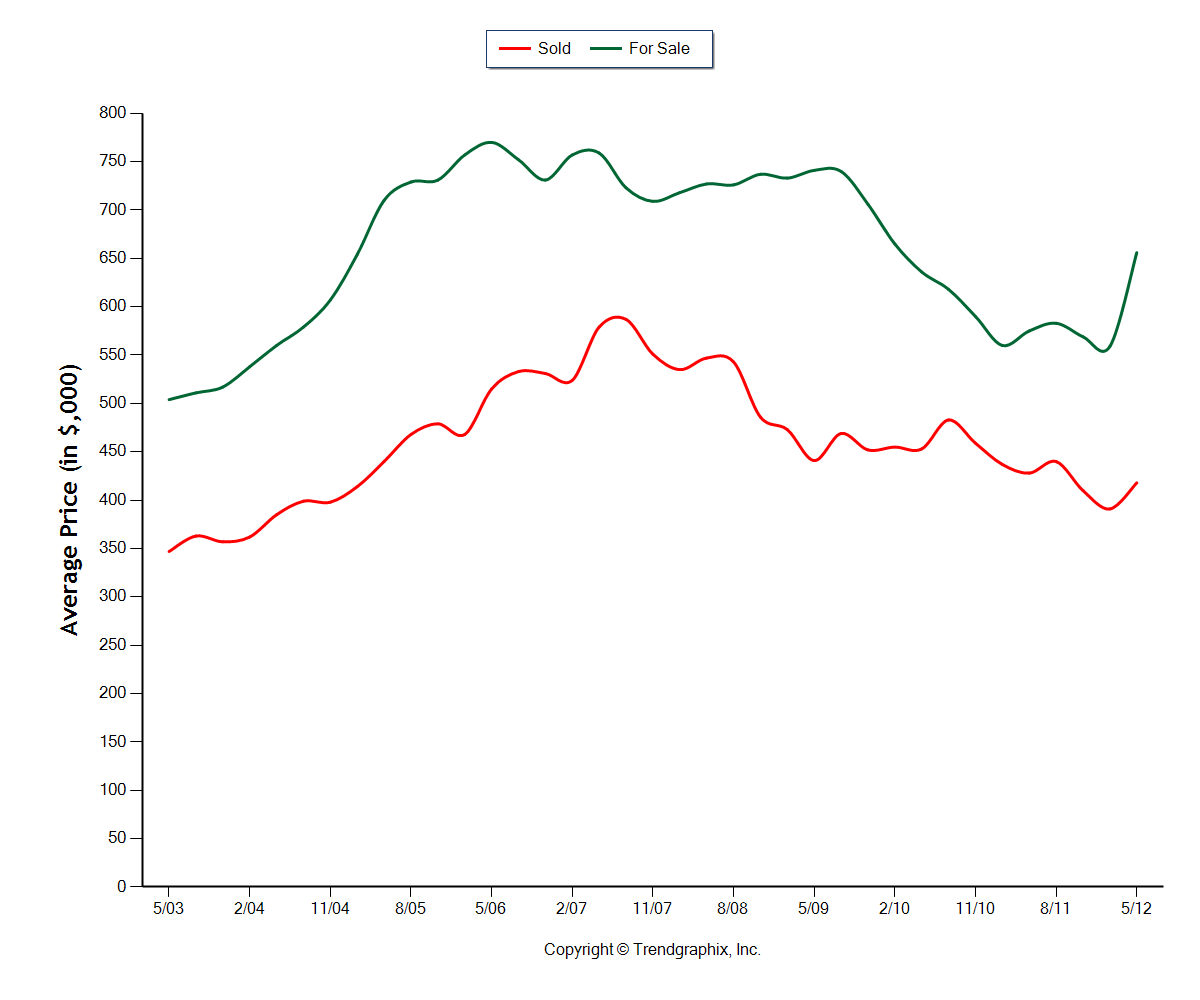
Is the housing market in a state of rational exuberance? Since the beginning of this year, activity, sentiment, and even prices, have taken a turn for the better. And it does seem that a solid case can be made that the housing market finally bottomed in late 2011 into the beginning of 2012. BUT, let’s not get too far ahead of ourselves and let’s not get too excited that prices are going to skyrocket and go up at a bubble inducing 10% per year again. However, if you look at the past 2 months in King County, “asking” prices are indeed skyrocketing up while sales prices have only increased a modest amount. Take a look at this chart for average For Sale and Sold prices in King County over the past 15 months:
The average listed price (the green line) is currently $693,000. That is up 5.5% over last month alone and up 19.5% from May 2011! The red line is the average sold price and you can see that it has bumped up a bit since the beginning of the year, but it is only up $1,000 from April and is still actually down nearly 2% from last May. Here’s the same chart over the past 9 years:
To me, that recent blip in asking prices seems a bit irrationally exuberant to me, given what we’ve been through. However, if you dive a little more deeply into the numbers, inventory numbers are very low under $500k and staying low up to the $1million mark. So it looks like a good part of this widening of the gap between bid and ask is that the lower priced and more affordable homes are just selling quick and often. Higher priced homes are staying on the market longer and therefore the average price of “for sale” homes is simply a higher average price. If you’ve been looking to buy a home lately, you’ll know that inventory is very tight, to nonexistent, under $500k and when something does come on the market, especially in desirable neighborhoods, it’ll often be met with a bidding war.
It is essentially a sellers market in the Seattle area right now, especially in the lower price ranges. However, that does not mean you can ask 20% more for your home than you could have last year, it just means that you can lean toward the top end of your price range rather than have to settle at the bottom of the range to undercut your nearest competition like we’ve had to do the past few years. Right now, you may not have any competition in your neighborhood because it has all sold.
The moral of the story is that sellers can be rationally exuberant about selling right now, but just don’t be too irrationally exuberant when it comes to pricing your home. The same laws apply: if you price it fair, present it right, and your home is in top condition, you will sell quickly.
Low Inventory = Good News for Sellers?
So far, the theme of 2012 is that there is definitely a lack of inventory. The housing market has been extremely busy in the low to median price ranges, but the upper middle to higher price ranges are starting to pick up steam too. The fact is, many buyers literally can’t find good homes to buy! Low prices and extremely low interest rates have pulled a lot of buyers off the fence in the first two months of the year. More homes will come on the market as we get into spring but that should be met with more buyers as well. So, it is reasonable to expect brisk activity for at least the next several months.
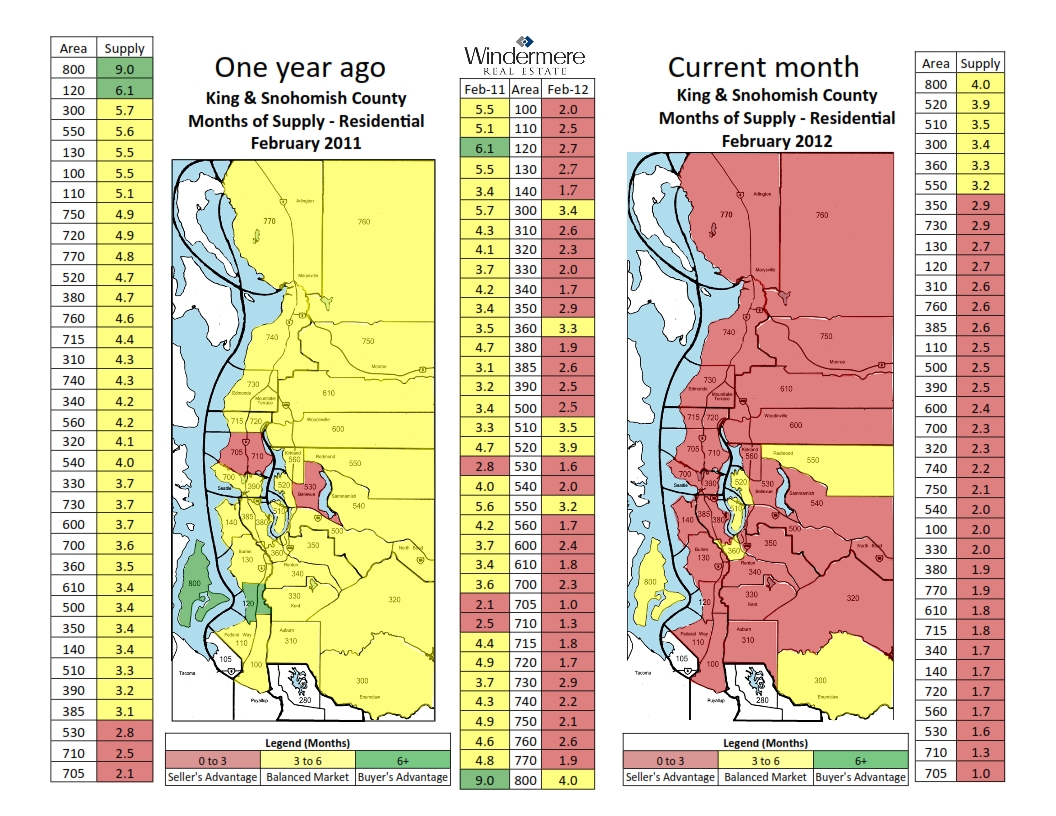
Since pictures can often tell a better story than words, take a look at this “heat map” for King and Snohomish Counties. It shows how most every MLS area has gone from a “balanced market” with 3-6 months of inventory in February 2011 to a “seller’s advantage” with less than 3 months of inventory as of the end of February 2012. Ignore most of the national news when it comes to housing because real estate truly is local. If you’re thinking about making a move, Call a Realtor with experience who knows your neighborhood to get specific professional advice for your situation.
North King County Real Estate Recap for January 2012
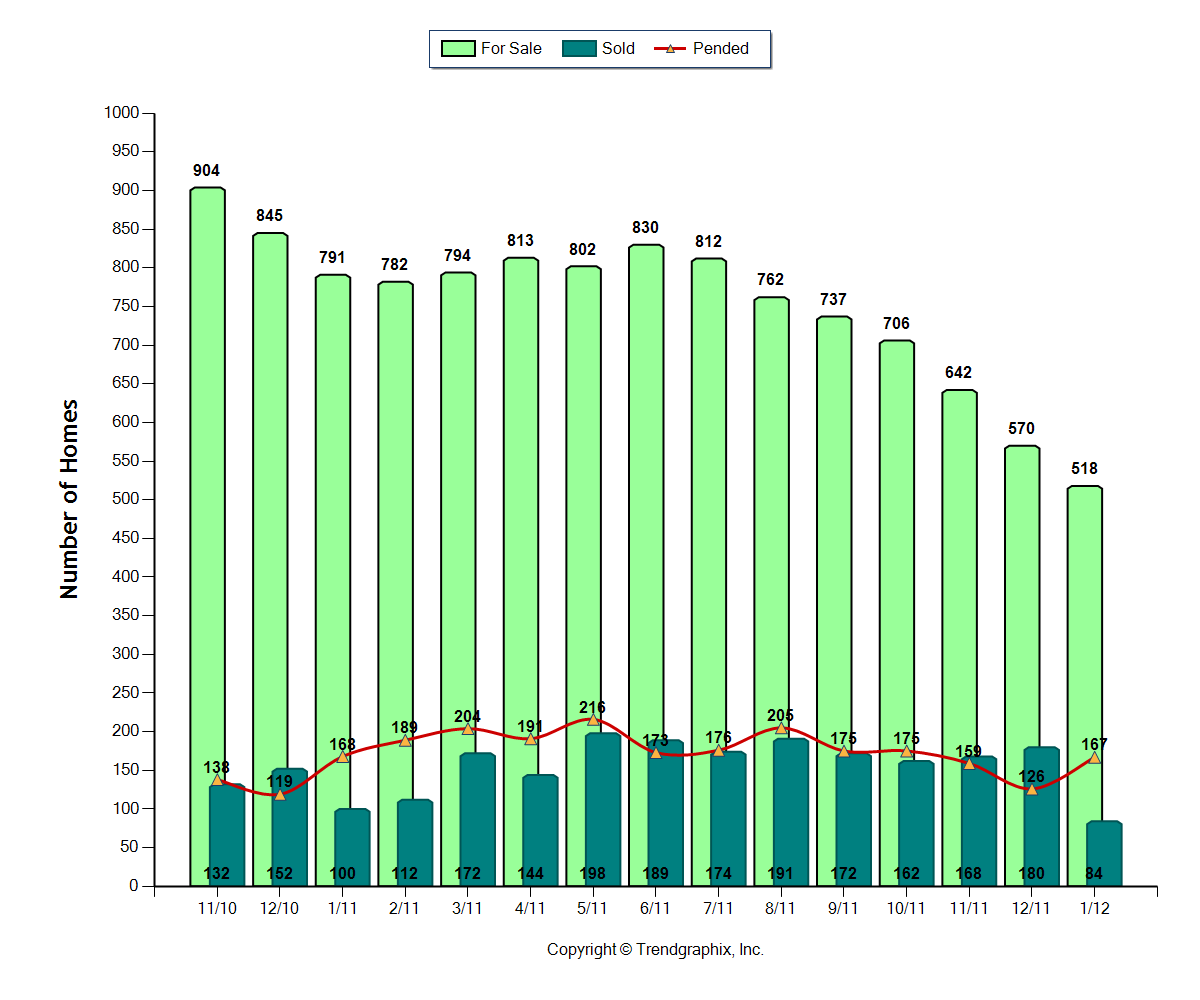
January housing market stats are out so let’s do a little recap and analysis of housing market activity in North King County. The charts below include statistics for the cities of Shoreline, Lake Forest Park, Kenmore, and the King County part of Bothell. This first graph shows the active homes for sale in light green, the homes under contract (pending) as the red line, and closed sales in blue. You can see quite clearly that the inventory of available homes is the lowest it’s been in a long time. Part of that is due to the time of year and it will be natural for more homes to come on the market as we get closer to spring. But even with the lower inventory, pending sales increased quite dramatically in January. That tells me there is some pent up demand from buyers and they are out there taking advantage of historically low interest rates and lower prices. A relatively small number of sales closed in January but that’s not too unusual because fewer people are making offers in December. The pending sales line should precede closed sales by 1-2 months so it is a leading indicator of sales that will close in February and March.
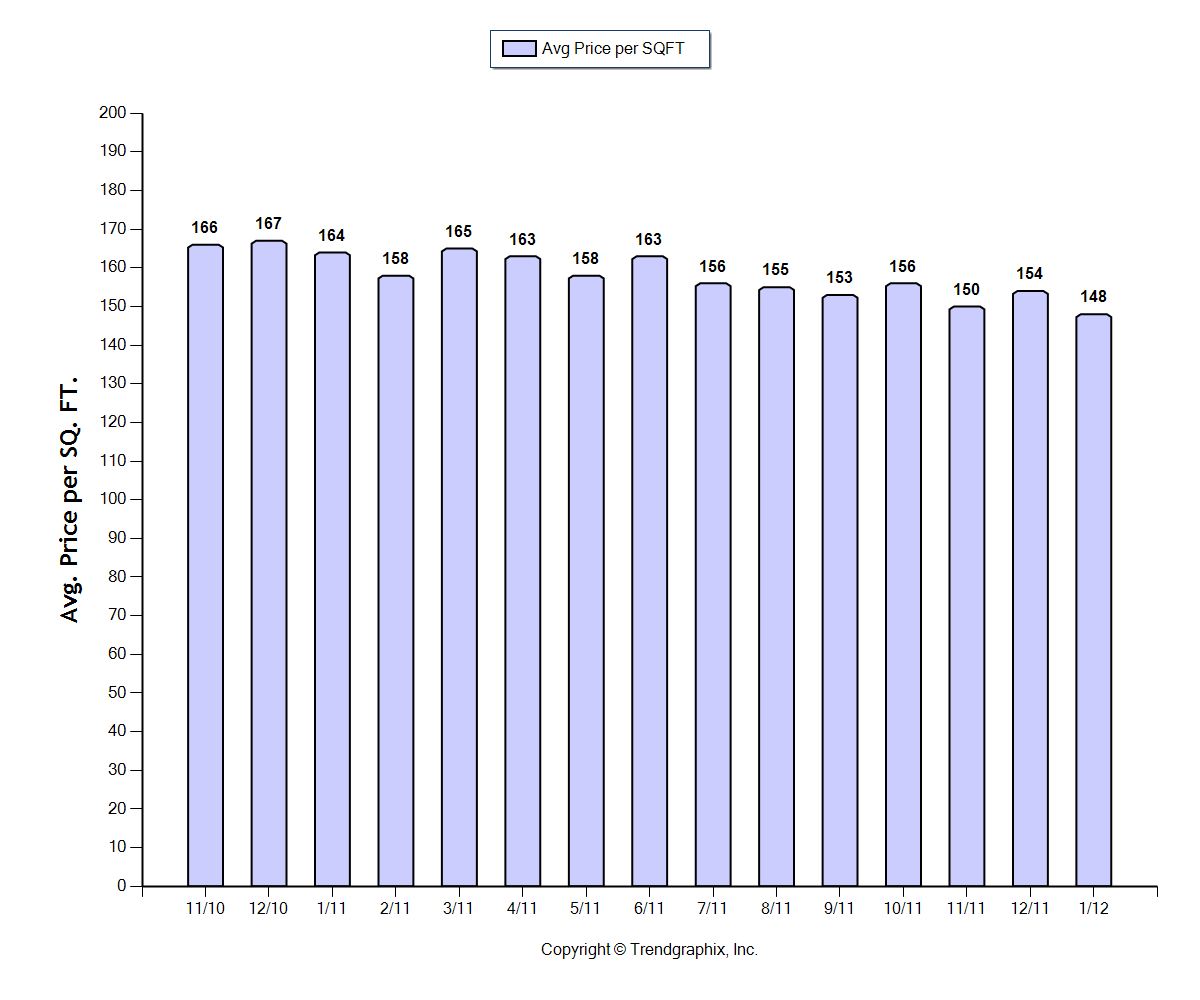
Now let’s look at prices. The average sales price for this north end of King County last month was $342,000 and $148/sqft. That is down about 10% from January 2011. BUT, I really don’t feel like you can say that all homes lost that much value last year. I believe that a lot this last year’s overall price decline is attributed to the fact that a higher percentage of lower priced homes sold. If you look just at homes priced between $300,000 and $600,000 in this same area, average prices actually increased slightly!
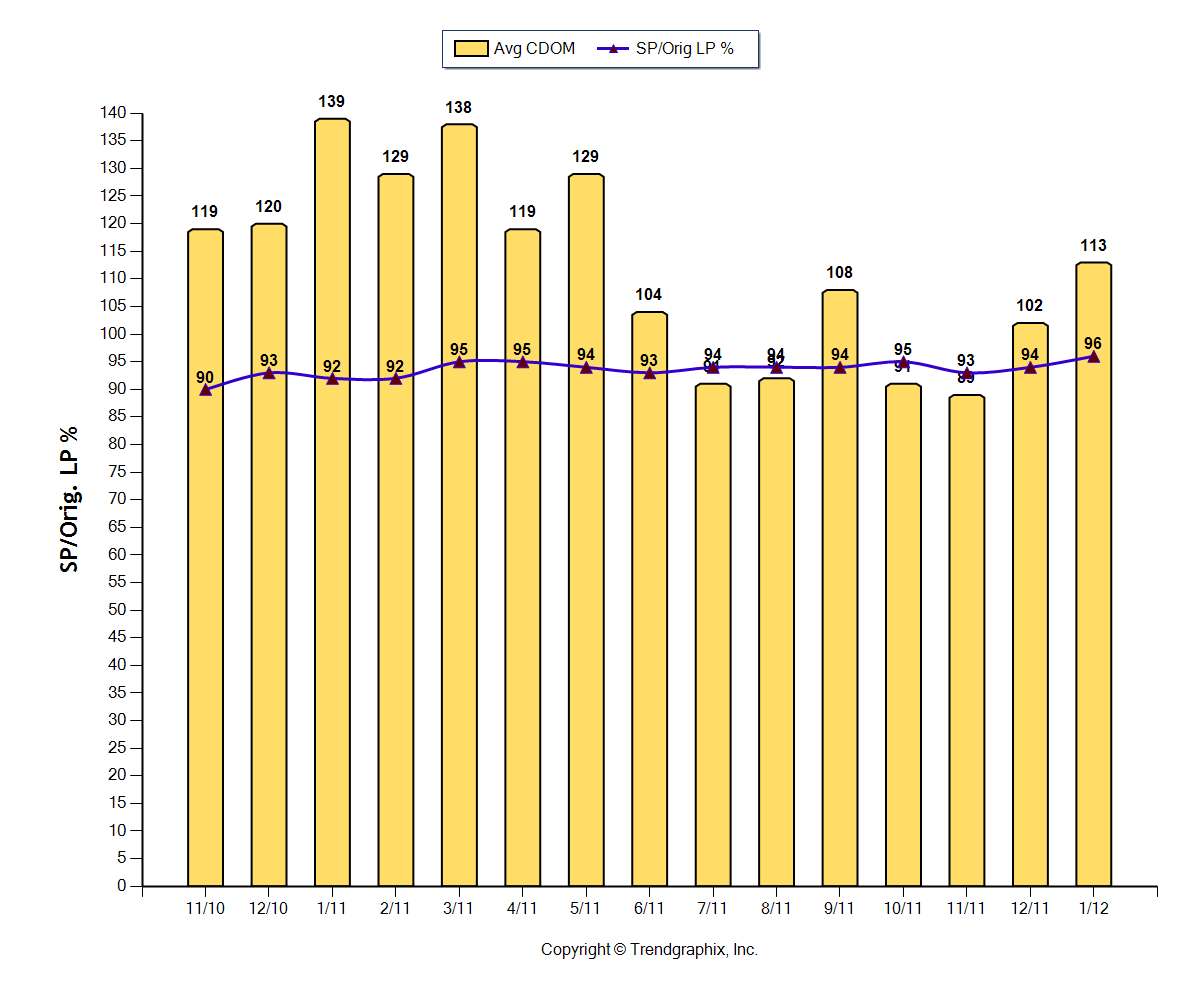
Average consecutive days on market increased to 113 from 102 days in December. But, we were at 139 days last January. And it’s very encouraging to see that the sales price, as a percentage of the listing price, increased to 96% from 94% in December and from 92% last January.
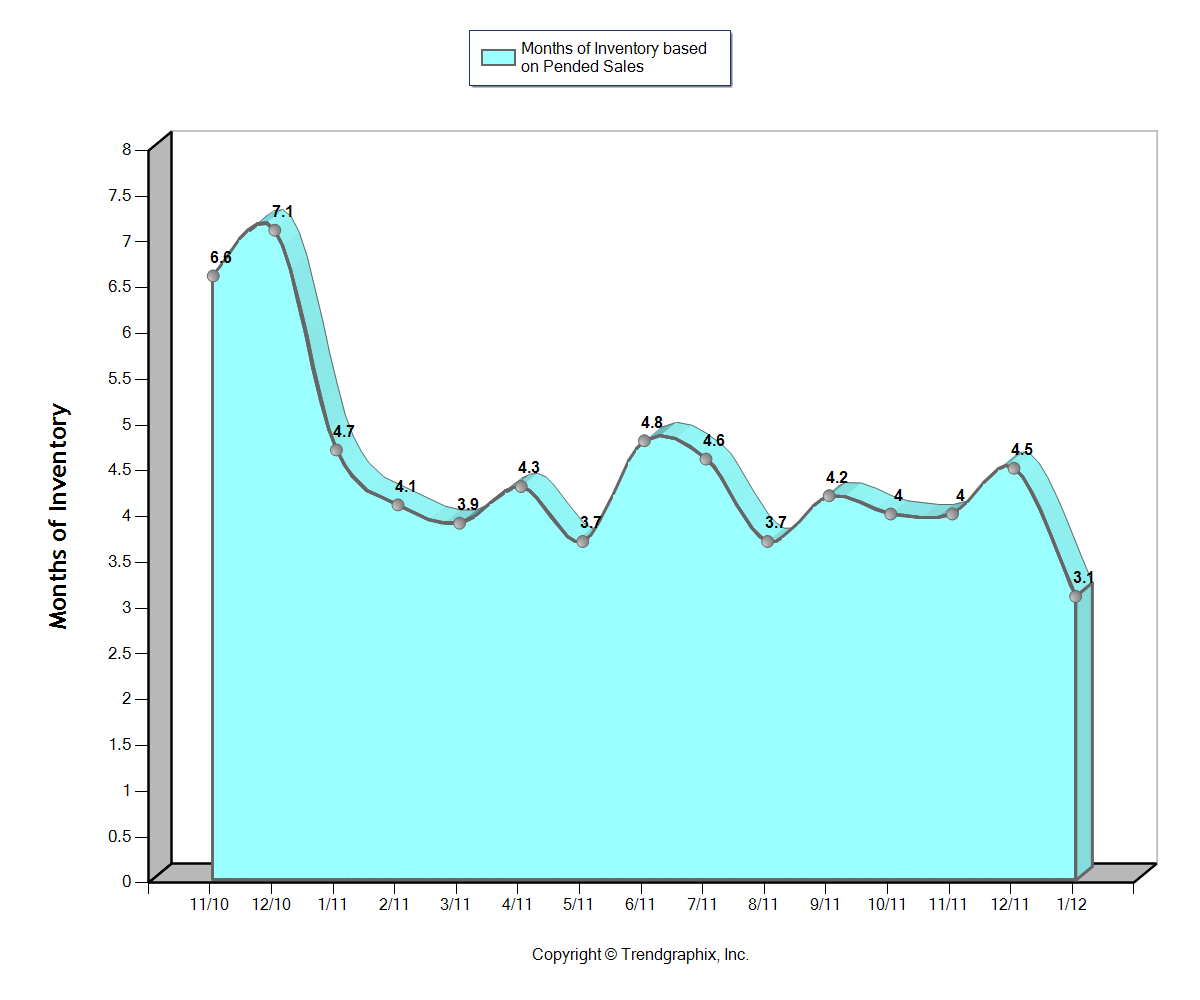
Finally, another measurement of the low inventory is shown in this Months of Inventory chart. We are at only 3.1 months of inventory based on Pending sales. Most of last year was very healthy in the 3.7 to 4.8 range. Getting under 3 months of inventory would basically be a sellers market while 3-6 months is a balanced market and above 6 would be a buyers market. Of course, every price range is different so there is definitely more demand in certain areas and prices than in others.
Real estate markets are extremely local so every house and neighborhood is unique. Use these trends as a guideline, but at the point you are thinking about selling your home, or if you find a new home that you think you want to buy, consult with a Realtor who knows your area who can assess the property, the neighborhood, and your specific situation.
*Statistics not compiled nor published by the NWMLS
Housing market starting to heal itself?
Latest NW Multiple Listing Service press release: “Housing market “healing itself,” numbers are “astoundingly good.” Click here for the full release: http://www.nwrealestate.com/nwrpub/common/news.cfm
King County Real Estate Recap for December 2011
Happy New Year! This month, I would like to give a perspective of King County real estate activity over the last 5 years…
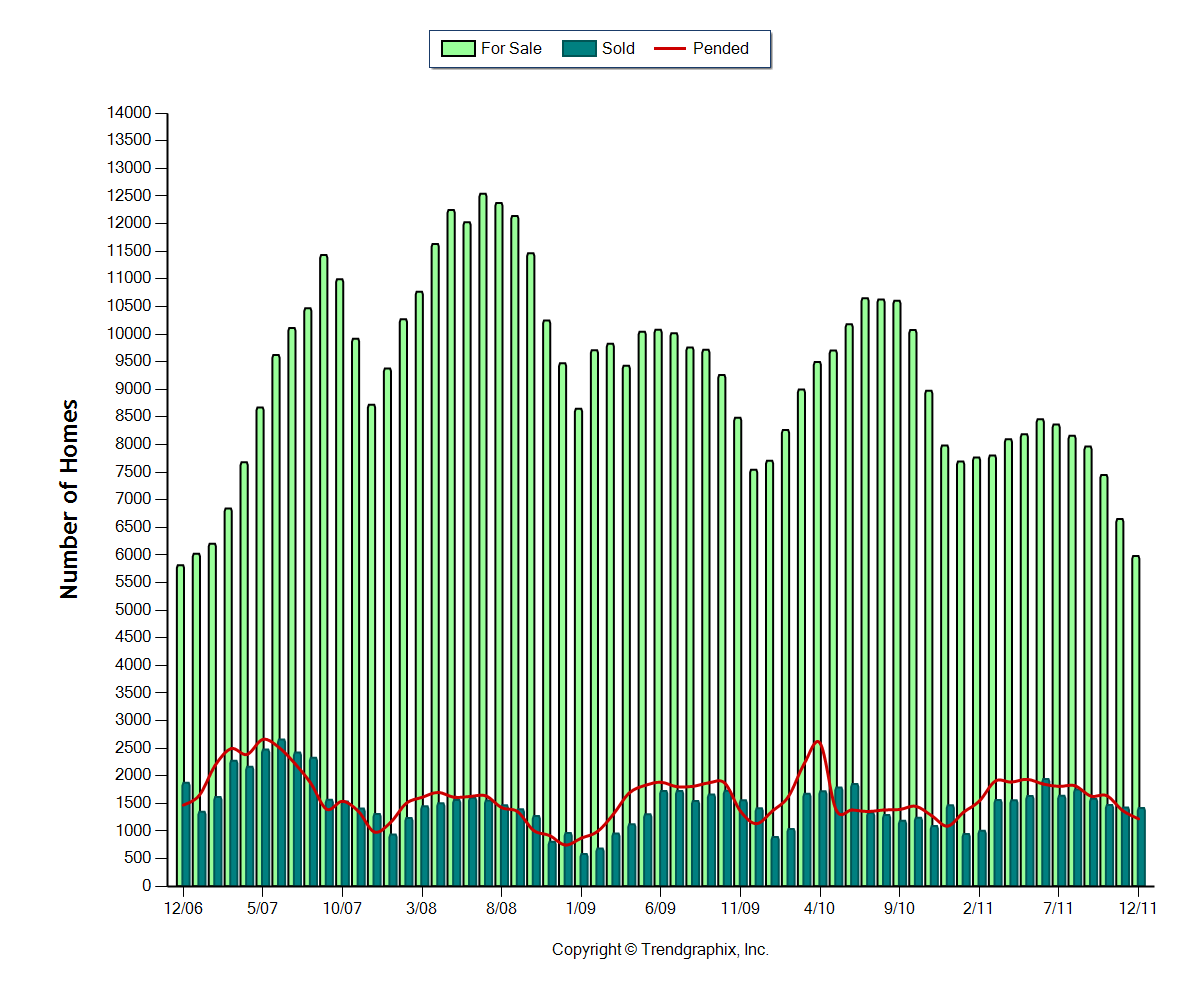
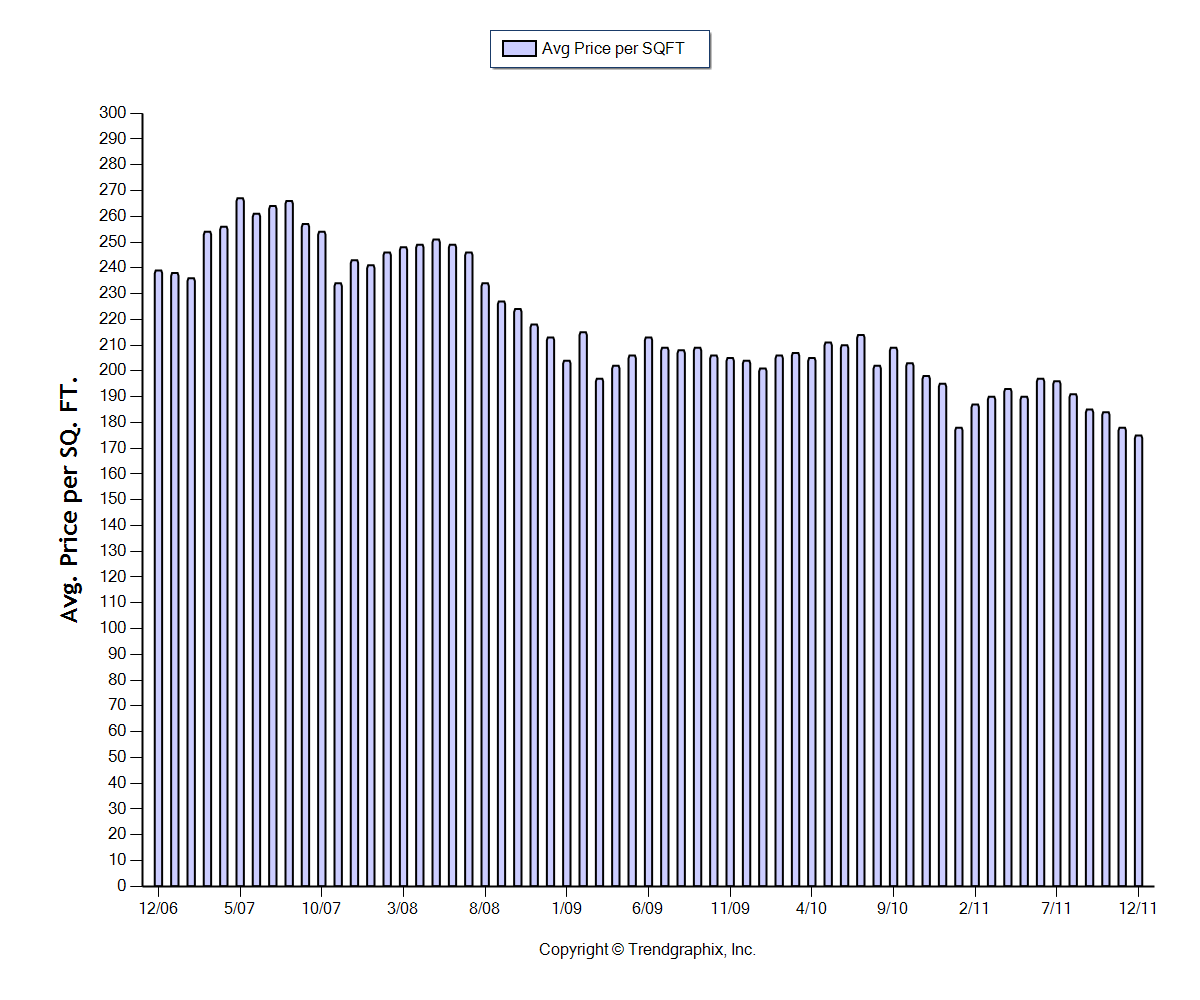
If you recall, at the end of 2006 and at the beginning of 2007, the housing market was starting to shudder a bit in other parts of the country, but things were still going pretty strong in the Seattle area. That spring of 2007 was very busy and prices and sales topped out in the middle of that year. The number of sales started to decline after June 2007 but the inventory kept ballooning to new heights until the middle of 2008. Inventory remained elevated through 2009 and most of 2010. Inventory in 2011 actually remained relatively low throughout the entire year and especially as we hit the end of the year.
Looking back to December 2006, we had almost exactly the same amount of active homes for sale as we did last month. But, the number of Pending sales has declined 17% and the number of sold properties has declined 24% since then. While that doesn’t sound great, Pending and Closed sales are up over 2010 levels so the market seems to be trying to find a base.
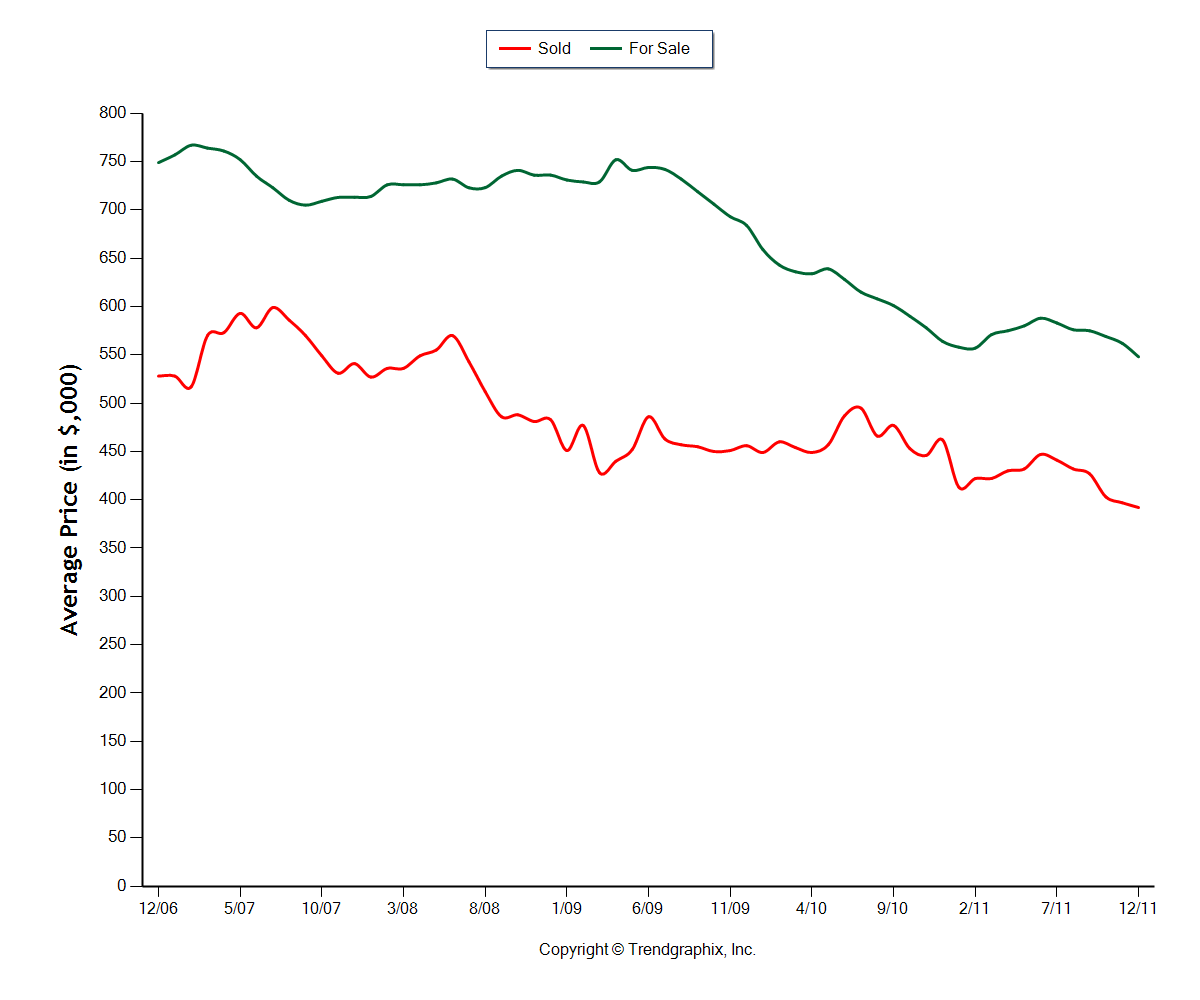
As far as prices go, in King County we peaked out in July 2007 at an average sales price of $599,000. Average dollar per square foot reached it’s top in May 2007 at $267/sqft. Last month, the average sales price was $392,000 and $175/sqft. That is a decline of a little over 34%. While we are essentially at new lows since the peak, part of the softness in pricing may be seasonal so I would suspect at least a little rebound as we head into spring and summer.
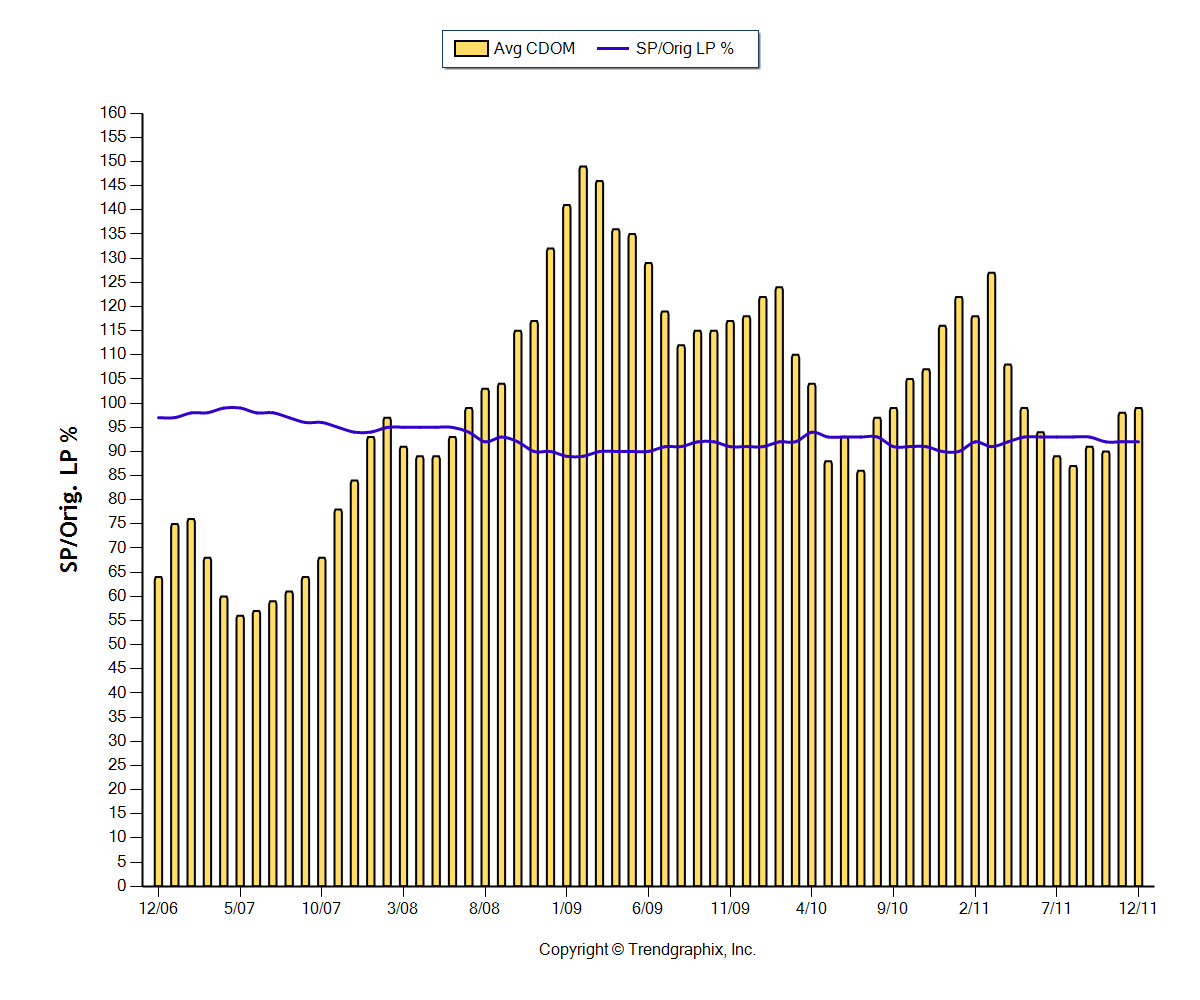
Another interesting market dynamic is to look at the ‘Average Days on Market’ and the ‘Sales Price as a Percentage of the List Price.’ In December 2006, we were averaging 64 days on the market. Last month, it was 99 days, or a 54% increase. Also, in December 2006, sales prices were averaging 97% of the Original List Price. Last month, homes were selling on average at 92% of the Original List Price.
Finally, after a wild ride up in late 2008 into 2009, the inventory of active homes for sale has come back down to pre-crisis levels. In December 2006, there was 3.1 months of inventory and last month there was 4.2 months of inventory. I can’t stress enough how important a modest amount of homes for sale is for a healthy market. It’s good old fashioned supply and demand. In the boom years in 2005/2006, there was a ton of demand and very little supply, and then in the bust years, there was huge supply but little demand. Now we are back to modest supply and modest demand which I think is a perfect recipe for securing a base from which prices and activity can grow.
January has started off with a bang with busy open houses and buyers resolving to get off the fence. I expect this to be a busy spring and another decent year overall with a slight increase in activity over 2011 and even a slight increase in prices. That’s just a best guess on my part but I think the housing market now has the wind at its back given that we have a slightly better economy and job market and there is the desire for politicians to “not rock the boat” in an election year. Top that off with a little inflation and I believe the market will be in better shape come 2013.
*Statistics not compiled nor published by the NWMLS
 Facebook
 Twitter
 Pinterest
 Copy Link

