Uncategorized June 9, 2010

Seattle Housing Statistics for May 2010

May stats are out and the immediate effects of the end of the tax credit are quite clear.  Pending sales have been nearly cut in half from April.  It shouldn't be shocking, but it is still a little disconcerting to see such a precipitous fall off at this time of the year.  In a way, it's hard to read too much into it at this point because it was an artificial stimulus to begin with.  It was pretty obvious a month ago, but it's even more obvious now, that some sales were pulled forward to take advantage of the credit.  We'll probably see a couple months of lower than normal pending sales to make up for it.  And hopefully it is just a month or two, not longer.

Delving a little more deeply into the numbers, you can see on the following chart, for King and Snohomish Counties, that while the pending sales dropped as I mentioned, the actual number of closed sales stayed pretty flat.  That's because all those pending sales are now closing in May and June.  Inventory did rise slightly which is normal for this time of year.

Ks1

The next 2 charts show that the average sales price for closed transactions went up 2% from April to $415,000 in May.  That is exactly the same as it was one year ago in May 2009.  The dollar per square foot price jumped 3.6% from April to $197/sqft in May and that is up 1.9% from last year.  Again, we are really going to have to keep an eye on prices and activity over the next few months to see how the market reacts to the end of the tax credit.  Only once the effects of the credit are finished filtering through the system will we really be able to see how Mr. Market is doing on its own.

Ks2 Ks3 
 

Here is a chart showing the average CONSECUTIVE Days on Market (CDOM) and the Selling Price as a percentage of the ORIGINAL List Price (SP/Orig LP%).  This is a little different from my chart last month that only showed the days on market and sales price essentially from only the last listing period.  Currently, the CDOM dropped to 92 days after being at over a hundred for a long time.  I'm sure that's due to the tax credit and I wouldn't be surprised to see that pop back up next month.  You can also see that the sales price as a percentage of the original list price is at 93%.  The percentage becomes 97% if you look at it versus the LAST listed price. 

What you can take away from this is that if your home is in good shape and you are priced right, you will get a higher percentage of your asking price and it will not take as long to sell.  But, many homes go on the market at the wrong price and aren't in great shape, and therefore they can spend months getting "stagnant" on the market and inevitably getting less than they could have if they were priced right from the beginning.

Ks4

Finally, here's a chart of the Months of Inventory based on closed sales.  This range we are in now should give us a relatively stable market, but if you look at it based on Pending Sales, there is a decent spike at the end which brings it back up to the top of the recent range.  I'll keep an close eye on that to see what happens as we filter out all the additional tax credit sales.

Ks5

To summarize, there is no question that the tax credit had an affect on sales going into the end of April.  How many sales were pulled forward from May, June, or later months, still remains to be seen.  But, the only way we're going to see how stable the market really is, is to get rid of the artificial stimuli.  We need to let the inventory clear on its own and let people make purchasing and sales decisions, not based on a random time line given to them by the government, but rather make those decisions based on natural market forces and on their own time lines.


Uncategorized May 11, 2010

April 2010 Statistics

April stats are out and I'm going to recap King and Snohomish Counties combined.  Every home and situation is different, but this will give you a general idea of what the numbers look like whether you're in north King County or south Snohomish County.  As an aside, if you ever want charts or statistics for some other area of Western Washington, or if you want more detailed information for your city or zip code, just drop me an email and I'd be happy to email you a report.

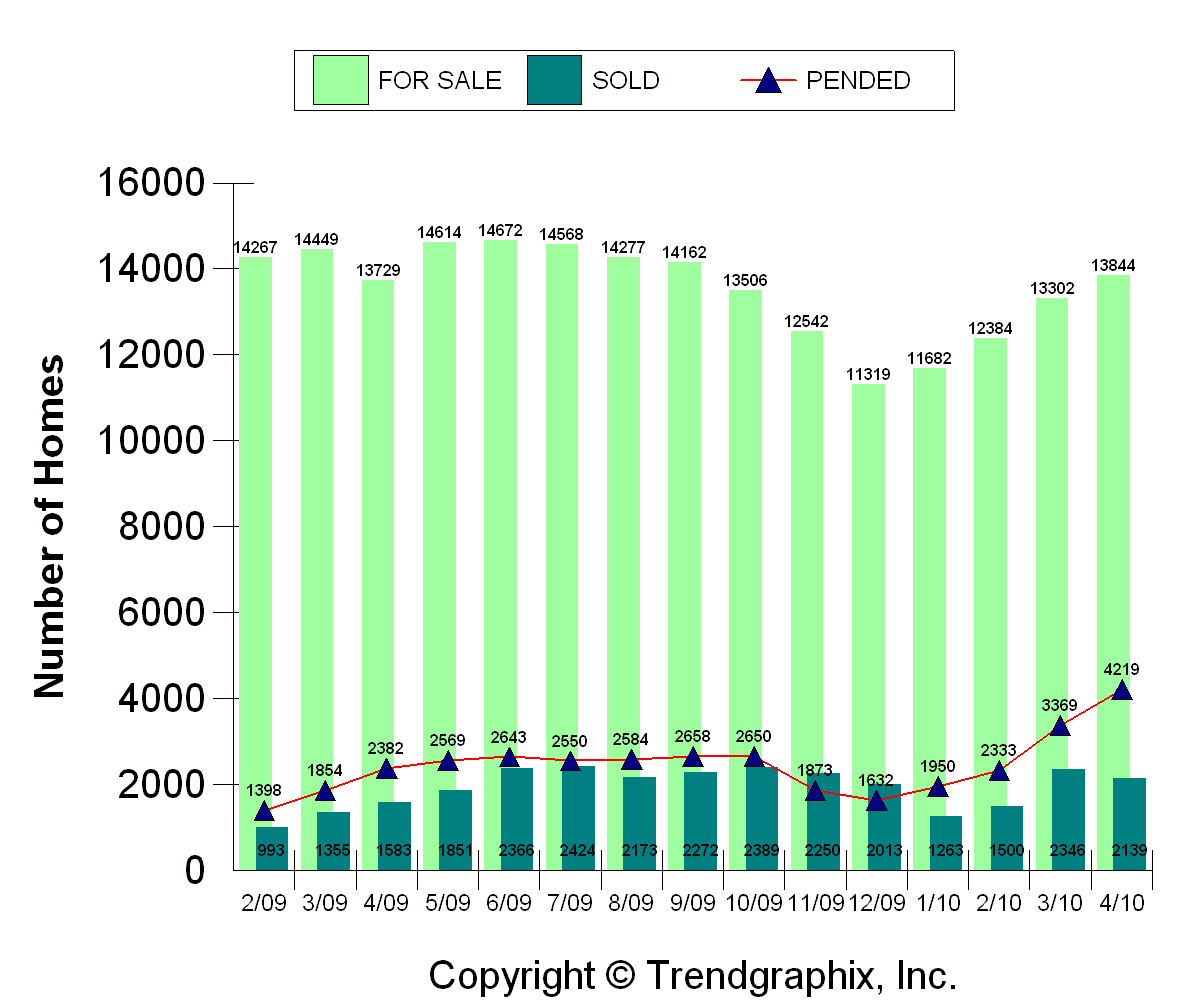
April 30th was the deadline to get an agreed upon contract if you were trying to take advantage of the tax credit.  It's been all the talk over the last couple of months and so now we will see how the market fares without this added support.  There's no question that there was a rush of activity to beat that deadline and the pending sales figures show that.  Pending sales were up 25.2% from March and 77.1% from last April.  Interestingly, closed sales fell by 8.8% from March, but were still up 35.1% from last year.  I am not sure whether that is due to sales failing or more due to the longer closing time needed for some lenders.  I have not personally seen a larger systemic problem with failed sales so I suspect that it's more likely a lender processing time line issue more than anything else.

Skc1

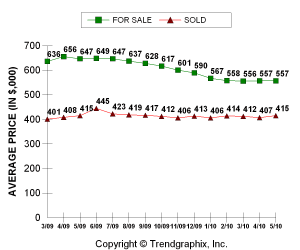
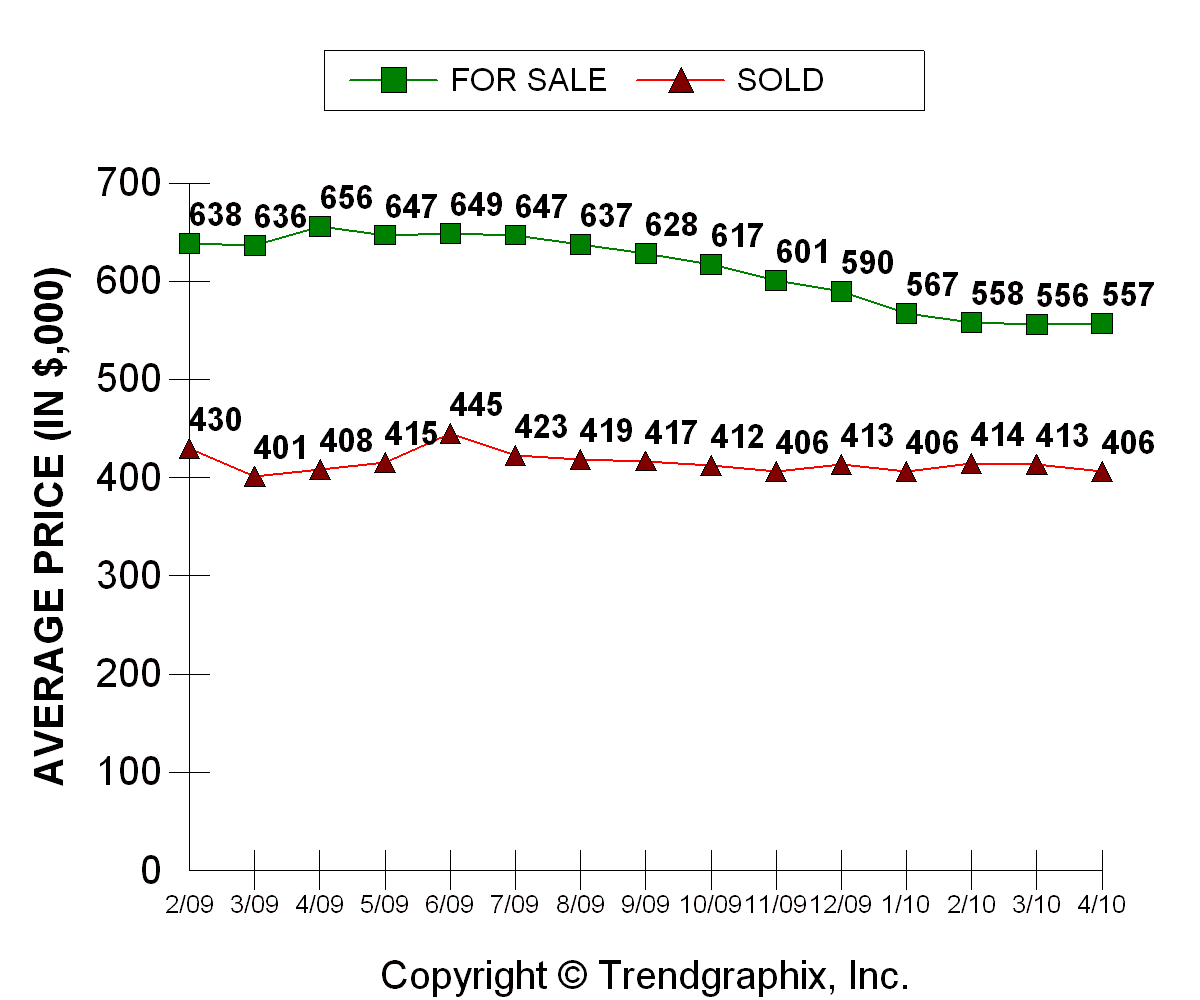
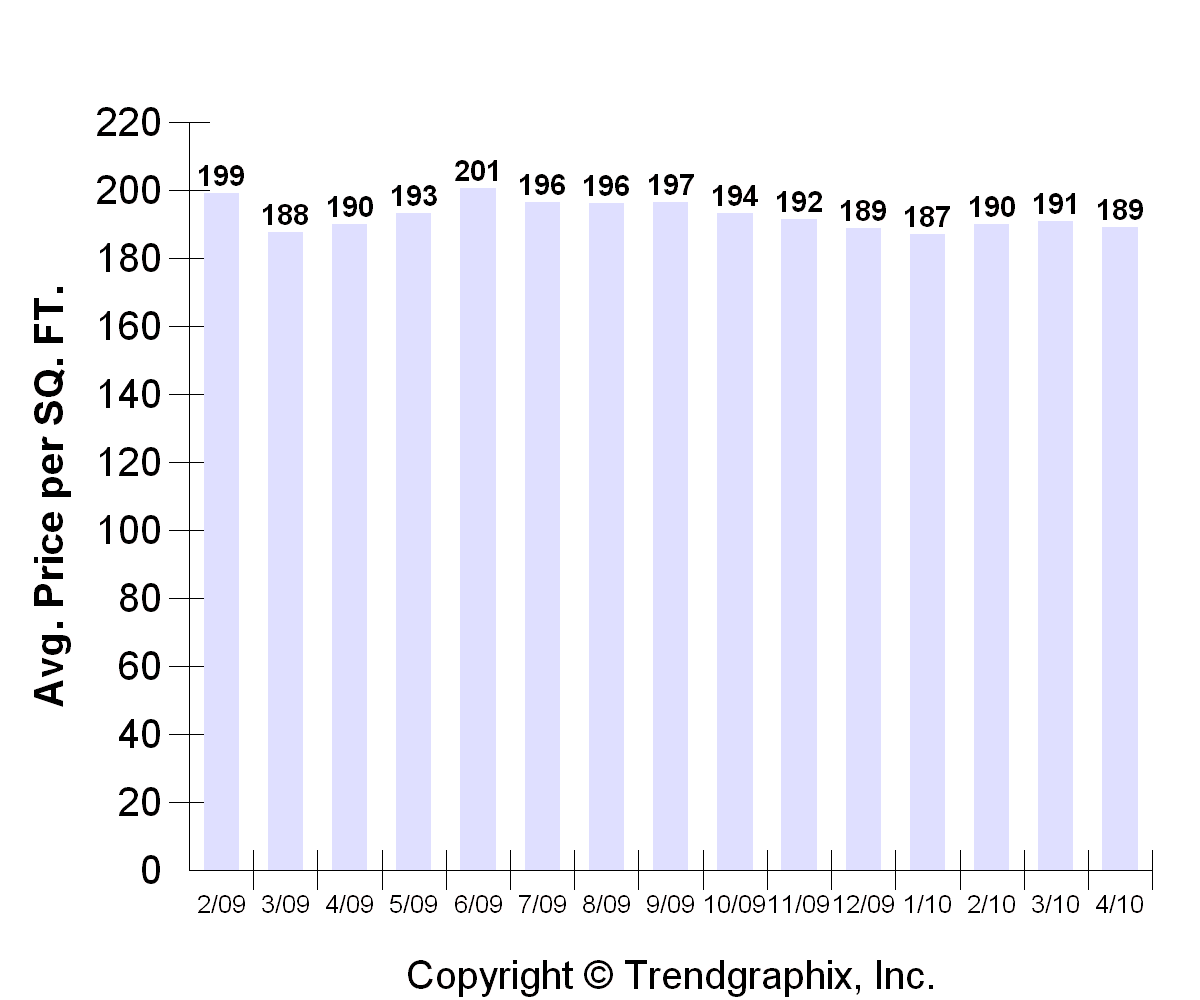
The next charts shows that the average sales price is $406,000 which is off 1.7% from March, but that is pretty much flat (-0.5%) from last April.  The dollar per square foot price is at $189/sqft which is down -0.9% from March and down -0.4% from last year.  Prices have basically been pretty flat over the entire past year, but it will be interesting to see if they soften at all, now that we have passed the tax credit deadline.  Many of those properties haven't actually closed yet so it may not be until after June until we see the full effect, if any. 

Skc2 Skc3 
 
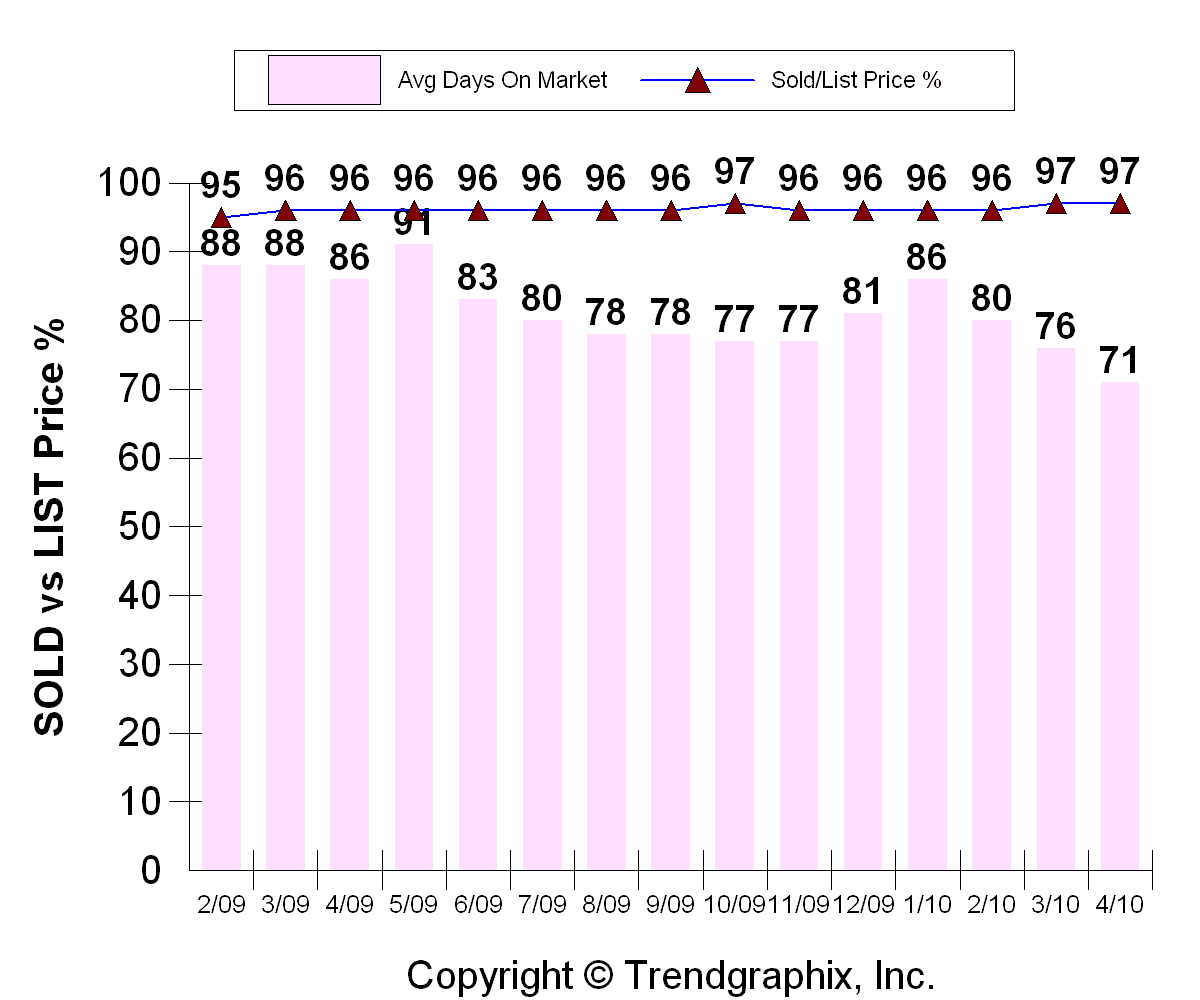
Average days on market fell to 71.  Again, the aforementioned deadline undoubtedly helped there.  And the sold vs. list price percentage held steady at 97%.  Keep in mind that this is the percentage of the LAST listed price, which could already have been reduced once or many times.

Skc4

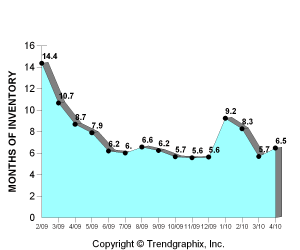
Finally, this last chart shows the "Months of Inventory" which just gives an idea of how much inventory is out there compared to how much of that inventory is being sold every month.  The lower the number, the more of a sellers market it is.

Skc5

To summarize, the market has been doing pretty darn well.  Given that the tax credit expired at this busiest time of year is probably a good thing as hopefully there will be enough demand out there to keep things going through the summer.  Whether any of the future demand was pulled forward, only time will tell. 

I know that we all can't schedule our lives around government stimulus programs, so when you need to make a move, just call a Realtor like me who's in touch with the housing market.  I will then explain the current market in your neighborhood and come up with an appropriate plan of action to get you where you want to go in the time you want to get there.

Uncategorized April 14, 2010

March 2010 Statistics

March stats are out and I'm going to give a longer perspective of what's been going on over the past 5 years…

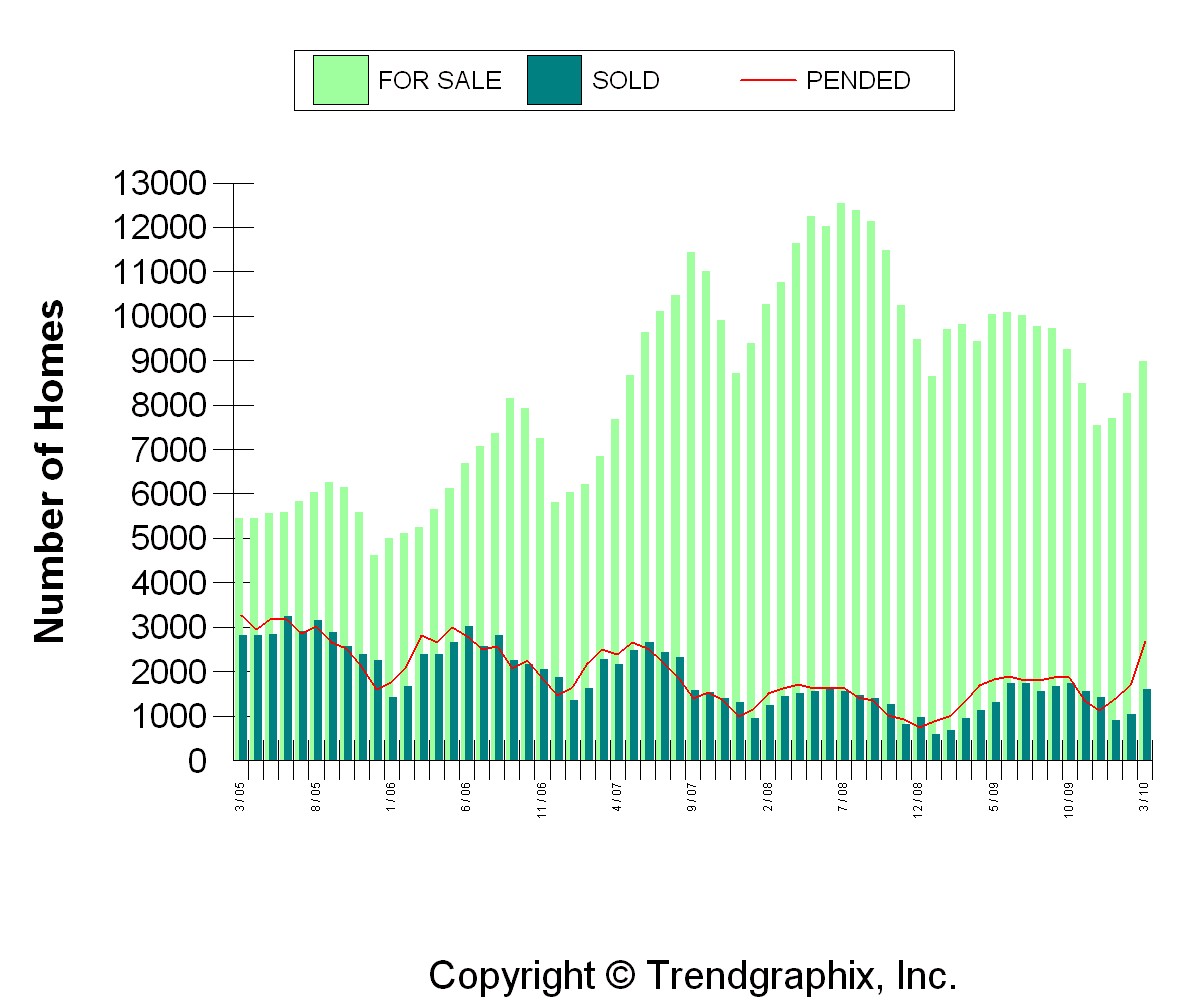
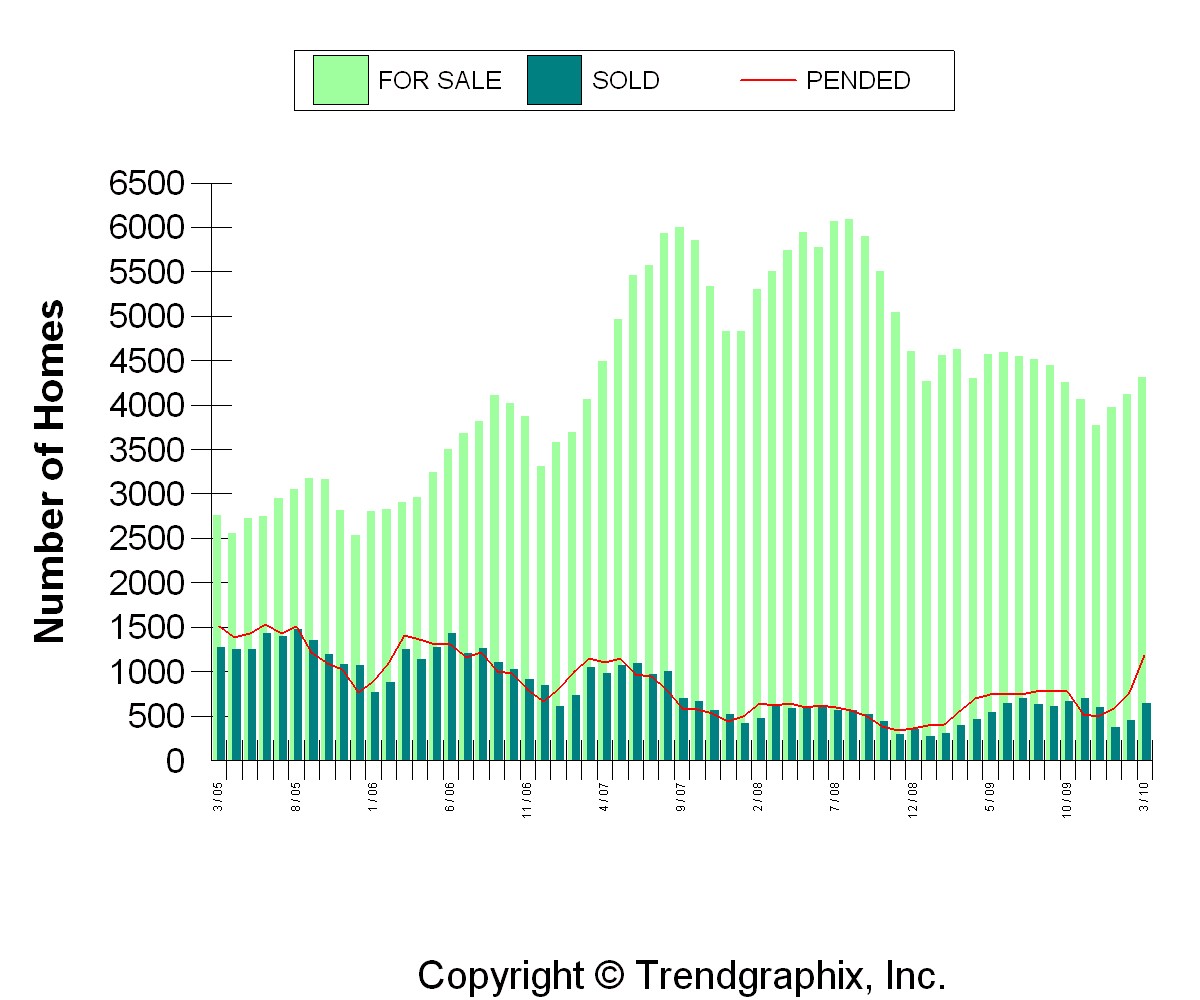
In my February stats post, I pointed out how big an uptick we had for pending sales.  Well, that trend continued in March.  For King County, pending sales in March were up 57.6% from February and up 105% from last March.  Sold and closed properties increased 54.2% from February and 66.1% from last March.  Active listings increased 8.8% from February but are down 8.5% from last March.  All this just confirms the improving trend of increasing sales with only a moderate increase in inventory.

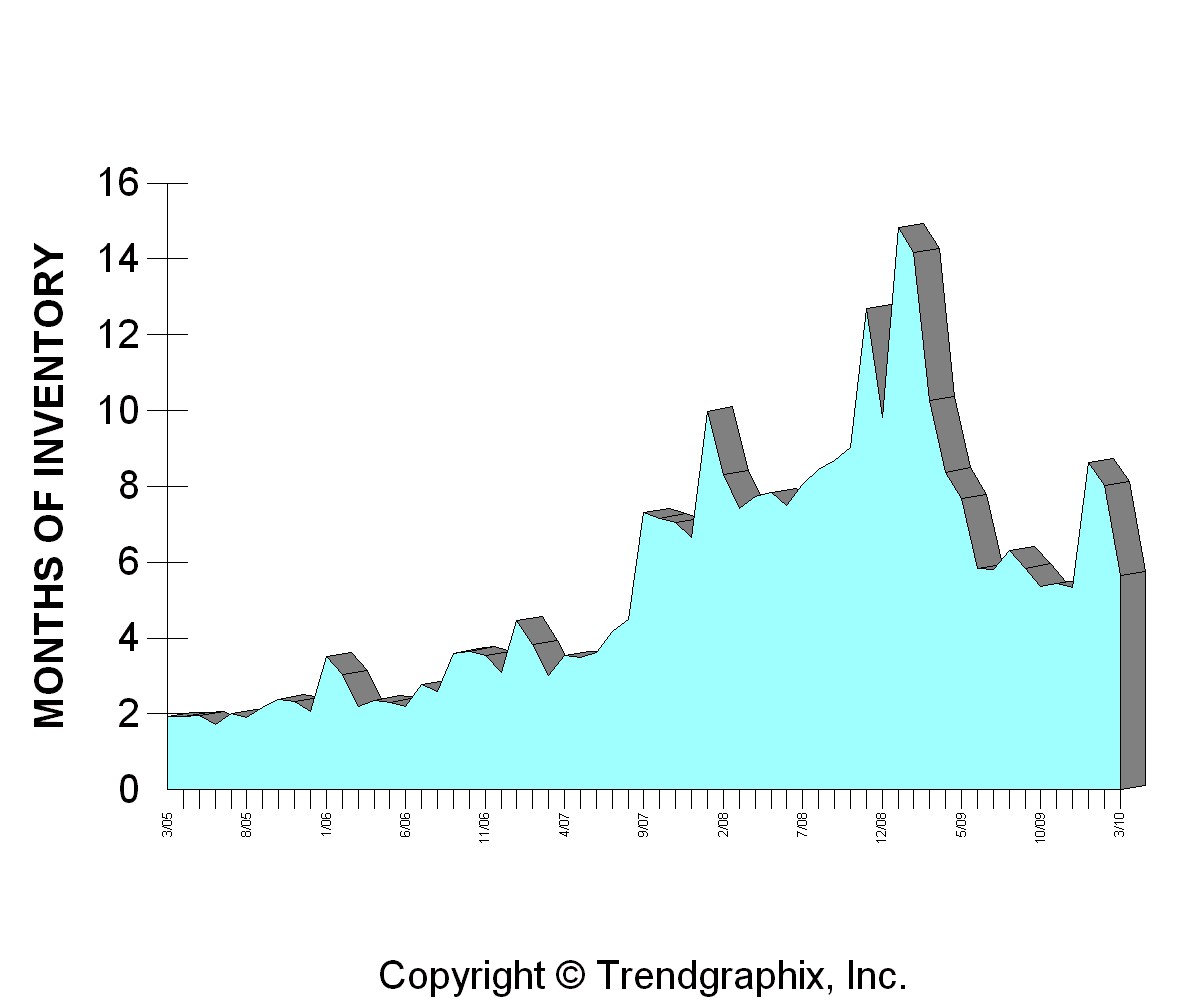
As promised, I will also give a longer perspective as well– As you can see in the following chart, inventory is still much greater than it was 5 years ago, and the sales are lower, but it's much improved since the middle of 2008.  Looking back at 2005, you can see that nearly half of the inventory was being sold every month!  Or in other terms, there was 2 months of inventory.  Currently, we are running at about 6 months of inventory.  That is closer to the historical average, but happily nowhere near the peak of about 15 months of inventory that we reached in the beginning of 2009.   

King1

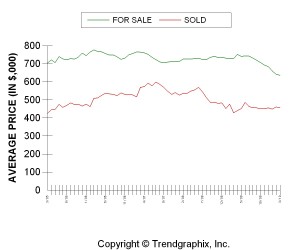
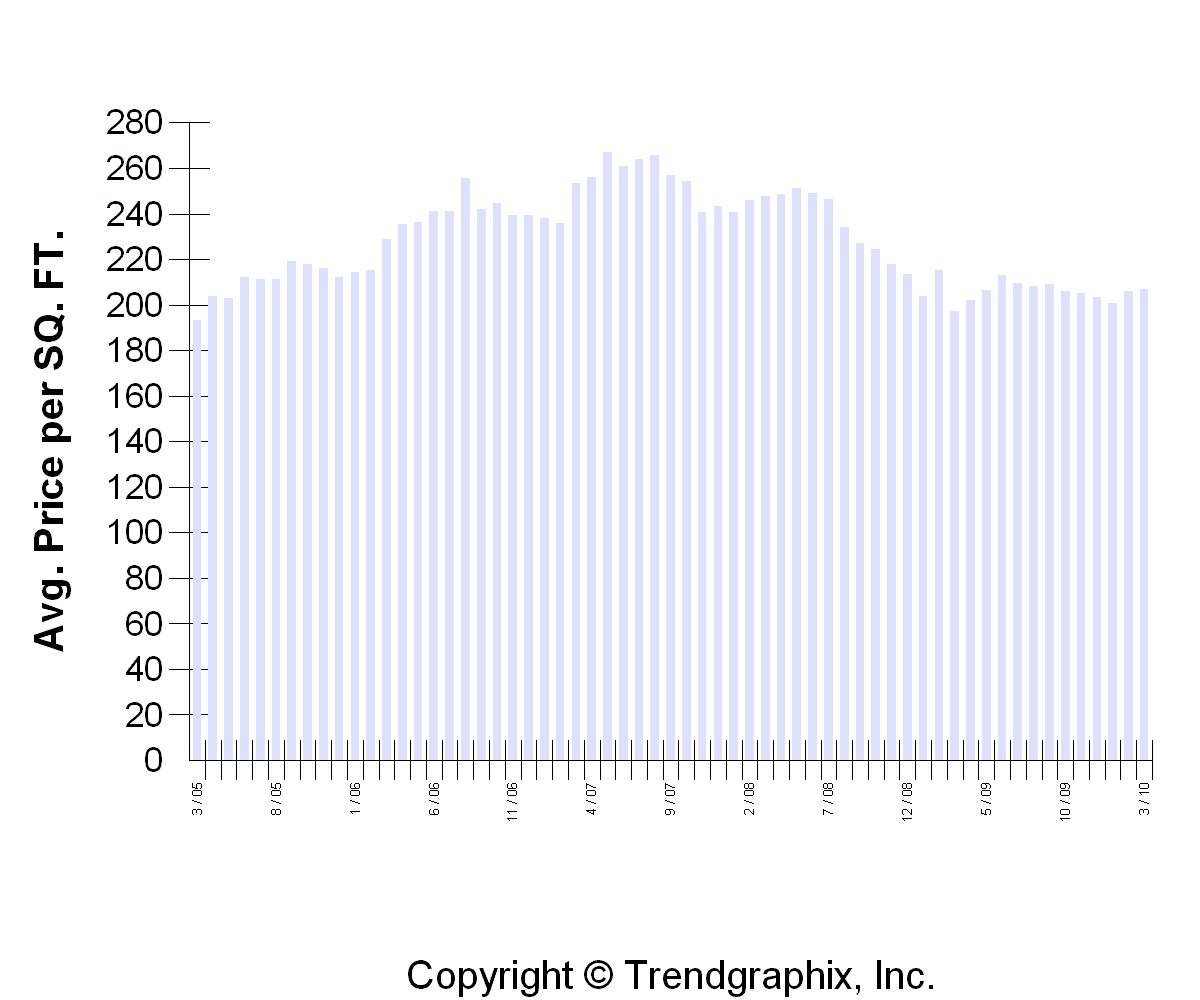
As far as sold prices go, King County is averaging $456,000 and $207/sqft, which is pretty flat compared with February, but up 5-6% or so from last March.  Again, to put it in a longer term perspective, the current prices are still up about 7% from March of 2005.  But, they are down 22-24% from the peak in the middle of 2007.

King2 

King3

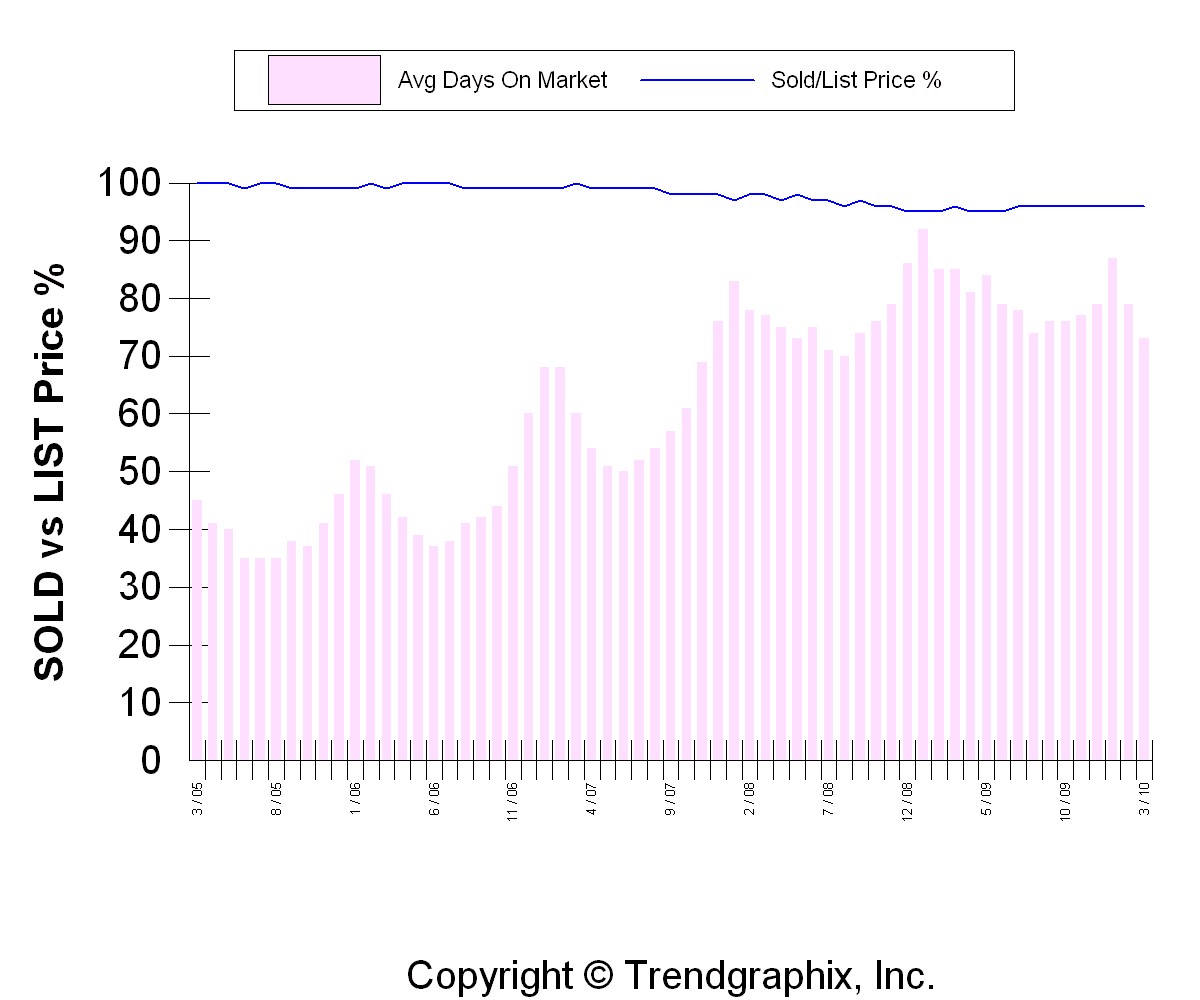
These last two King County charts show that the average days on market is running at about 73 and the sold price as a percentage of list price is at 96%.  That's been fairly consistent over the past year but look how the AVERAGE was at 100% 5 years ago.  The second chart shows the months of inventory as a graph over the past 5 years.  If we can keep that in the 3-7 month range, we will be doing just fine.

King4 King5

Finally, I will post 5 similar charts for Snohomish County.  All the trends are essentially the same, except the prices are generally lower.  Average prices are running at $310,000 and $151/sqft which is pretty flat compared with February, but down close to 8% from last March, and statistically pretty flat with March of 2005.  So, prices have dropped a little more in Snohomish County than in King County and that's further reflected by the fact that they've decreased approximately 27-28% from the highs in 2007. 

Snoh1 Snoh2 Snoh3 Snoh4 Snoh5

So, I hope that puts a little perspective on the market over the past half-decade.  We're getting back to a more normal market where a home is just that- a home to live in first and long term investment second.  I'm still very confident that owning real estate is a great investment over time, especially as the value of the dollar decreases with inflation.  Just don't expect to be able to flip a home in 1 or 2 years with a 20% return…


Uncategorized March 9, 2010

February 2010 Statistics

Where did winter go?  It already feels like spring here in the NW and our very mild winter led to a very mild "off-season" in real estate.  Activity chugged along quite nicely over the coldest months and it is really starting to pick up steam now. 

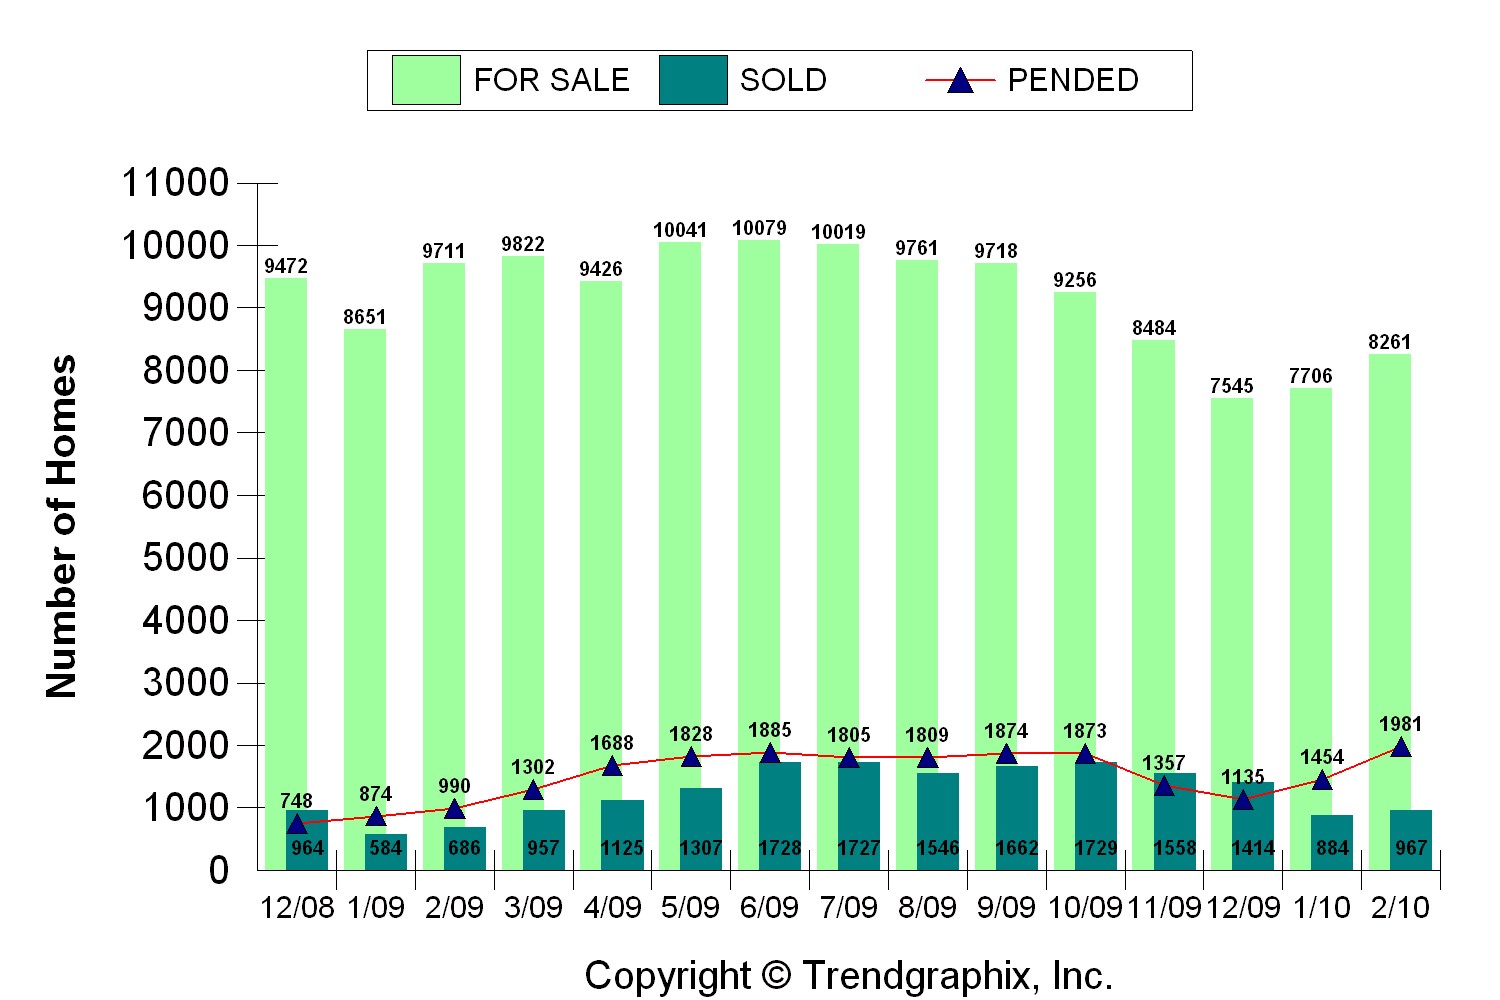
This chart shows that while active listings in King County have increased 7.2% from last month, they are still down nearly 15% from last February.  At the same time, pending sales have bolted to about a 30 month high, or 165% gain over last year, and sold and closed homes have had a 41% increase over February of 2009. 

King1

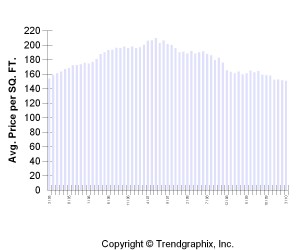
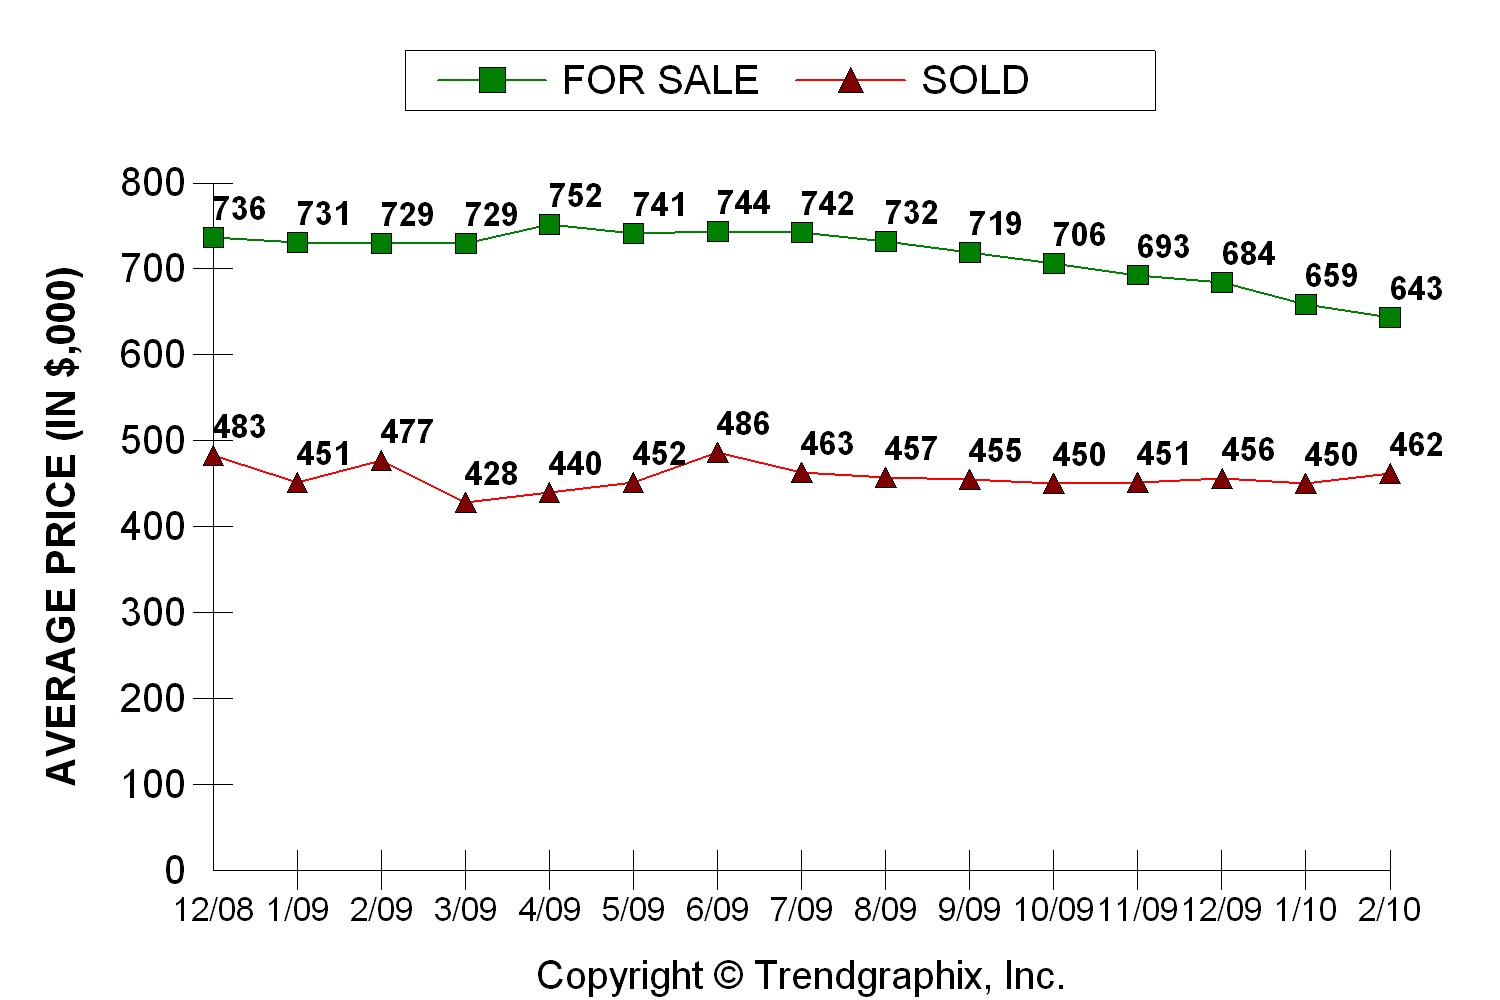
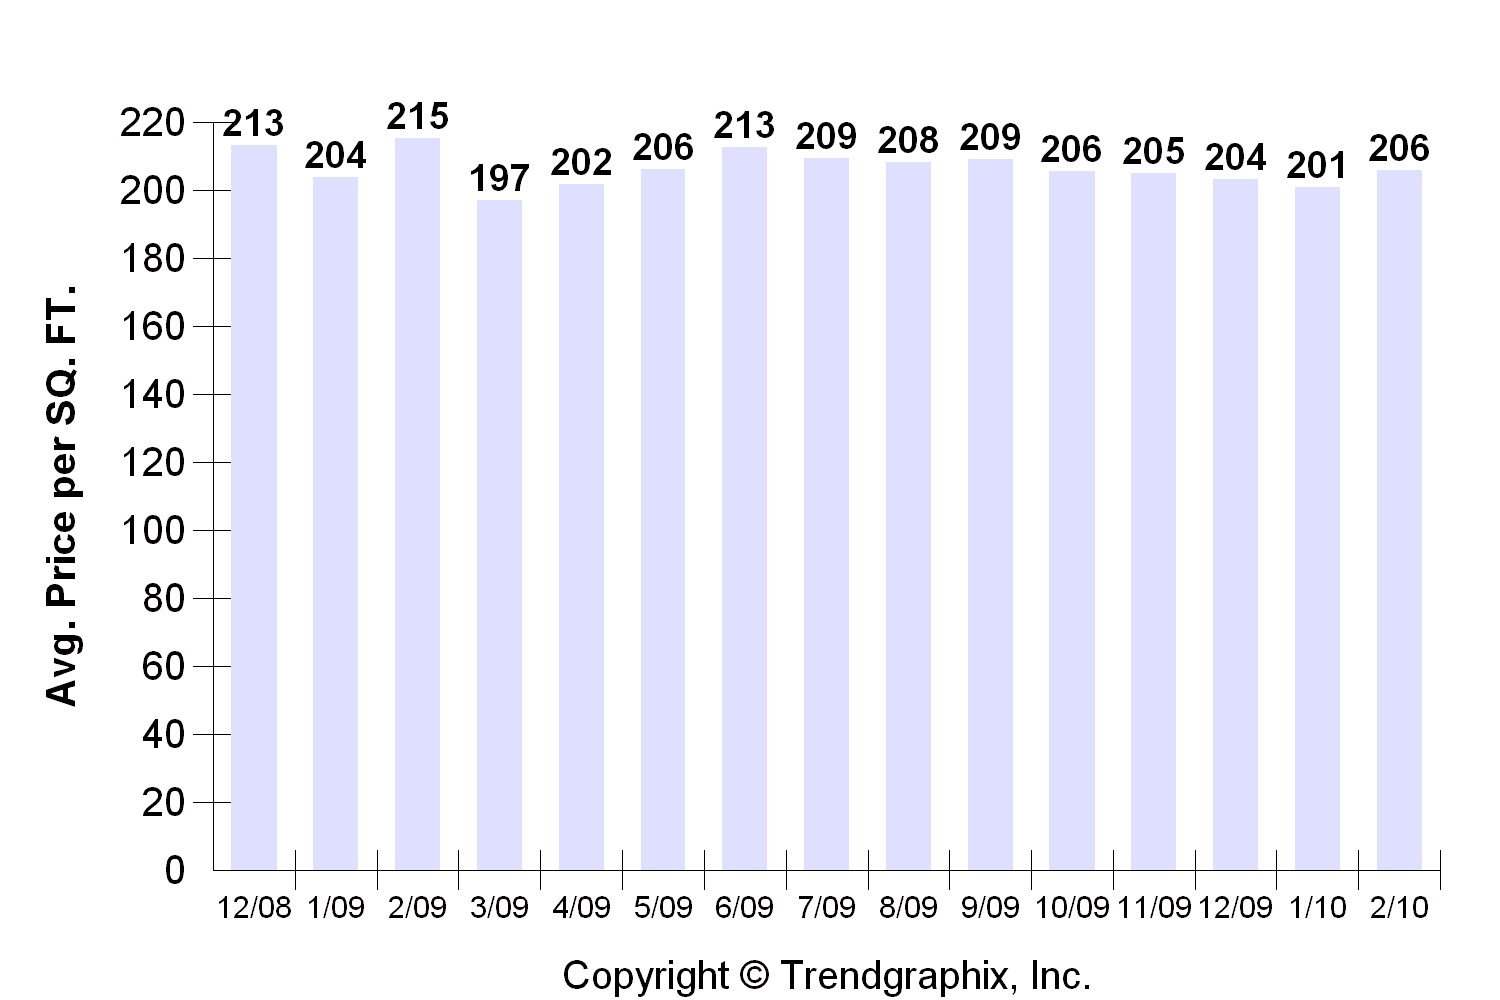
As far as prices go, the average sales price in King County was $462,000 and $206/sqft, which is down about 3-4% from last February, but up 2-3% from January.

King2

King3
 

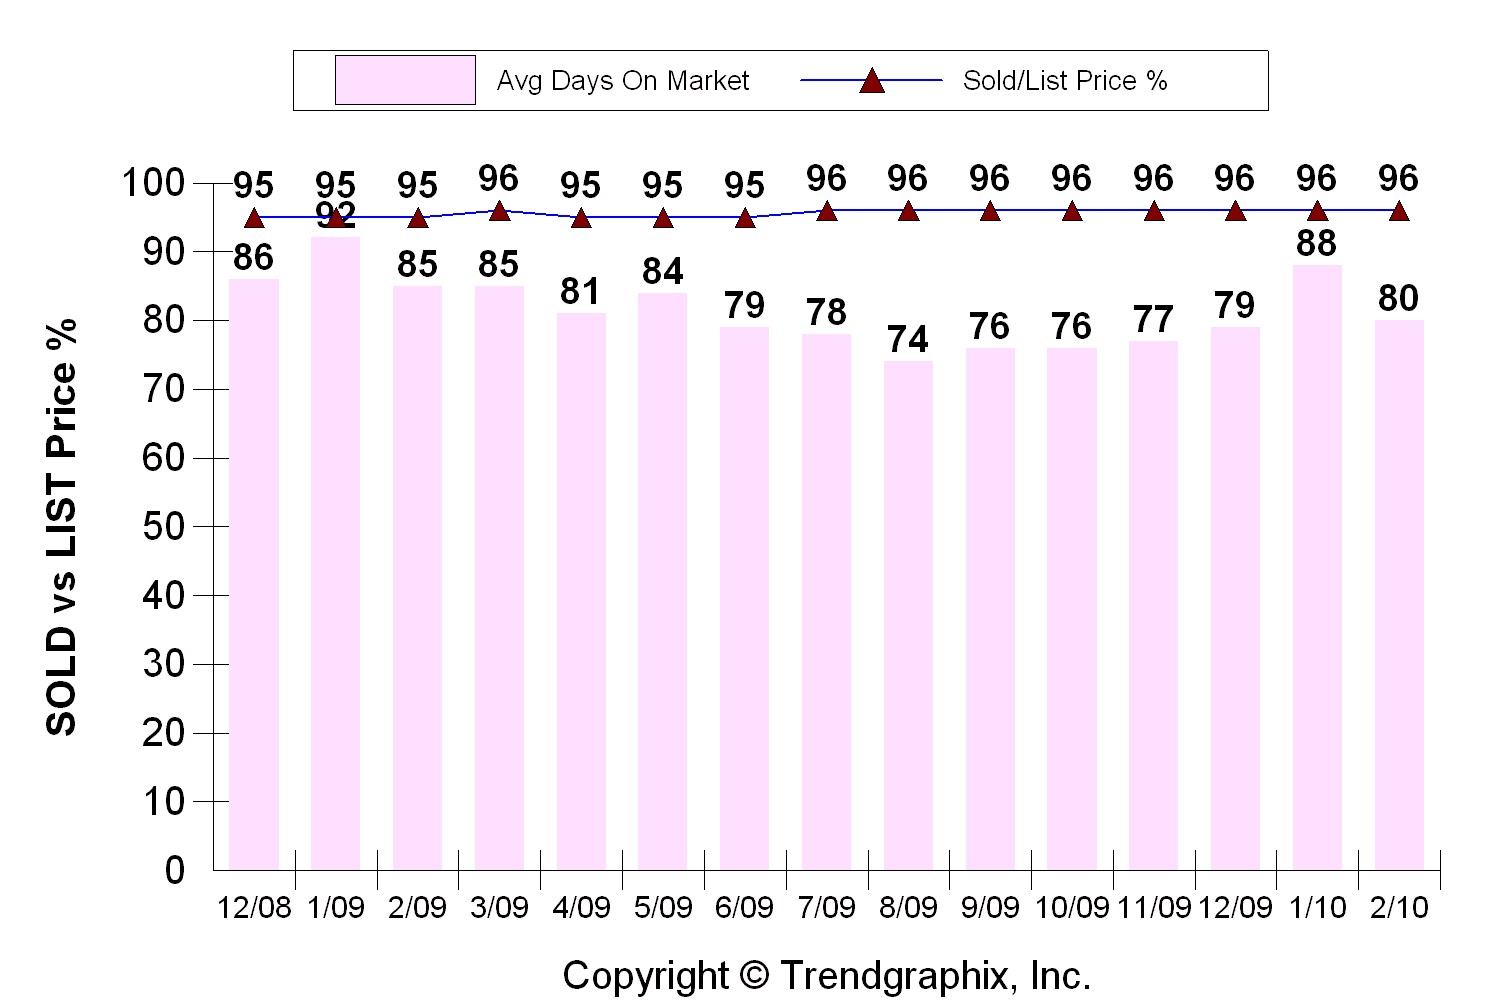
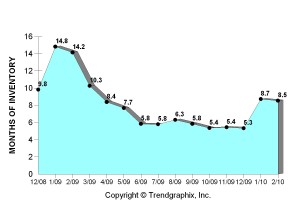
Days on market is running at 80 with an average sold/list price percentage of 96%.  Months of inventory has held fairly flat at 8.5 months.

King4

King5


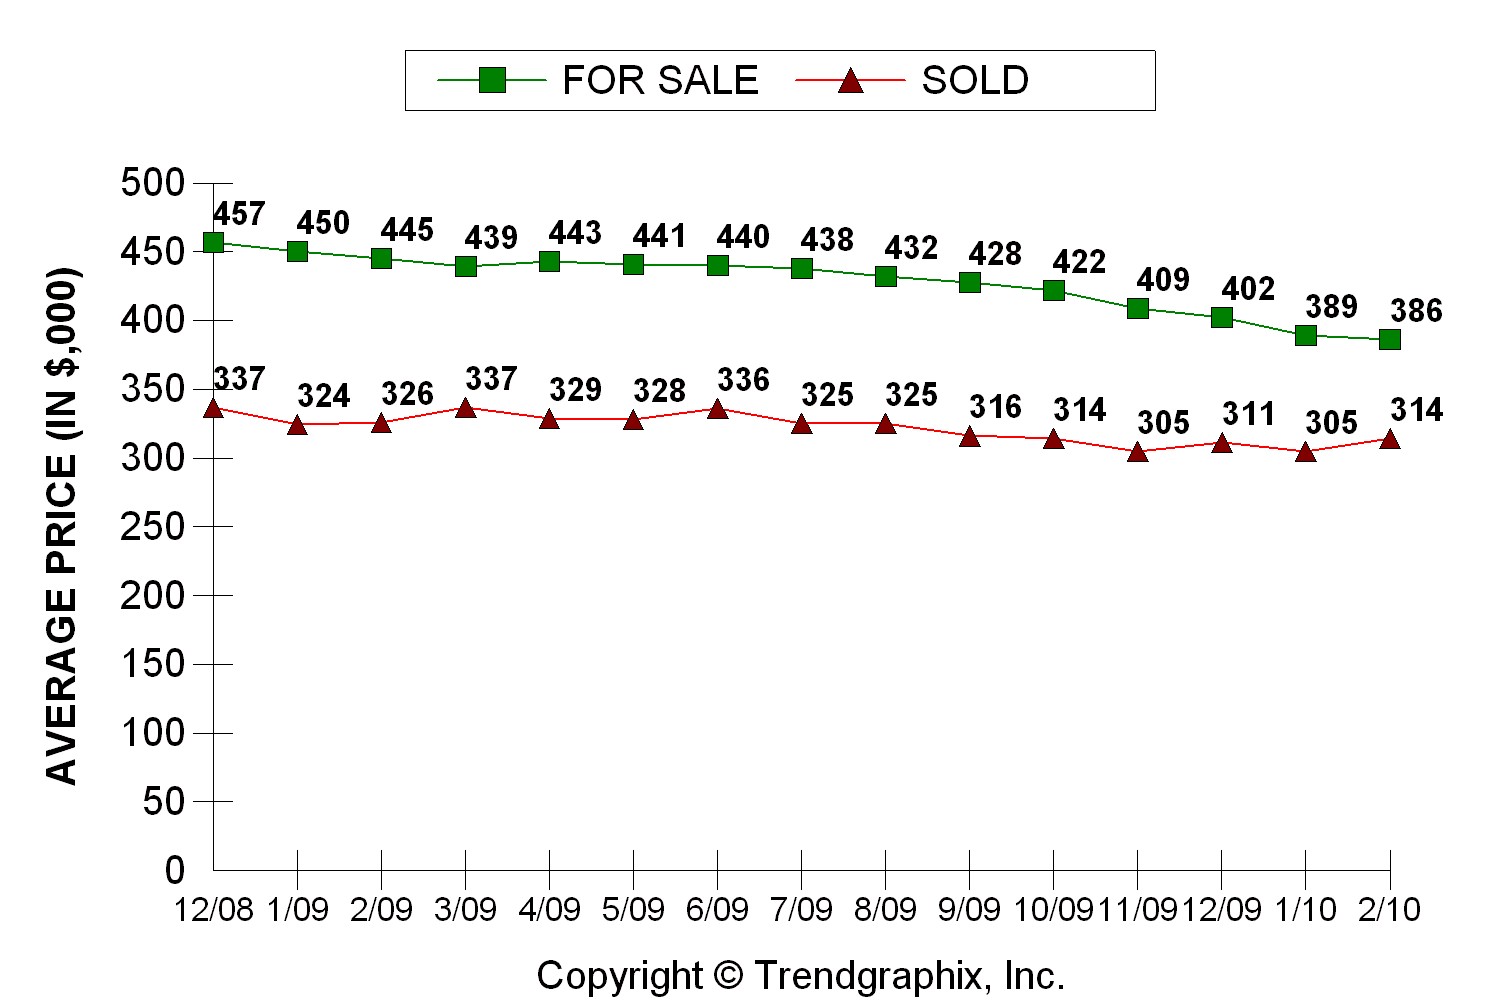
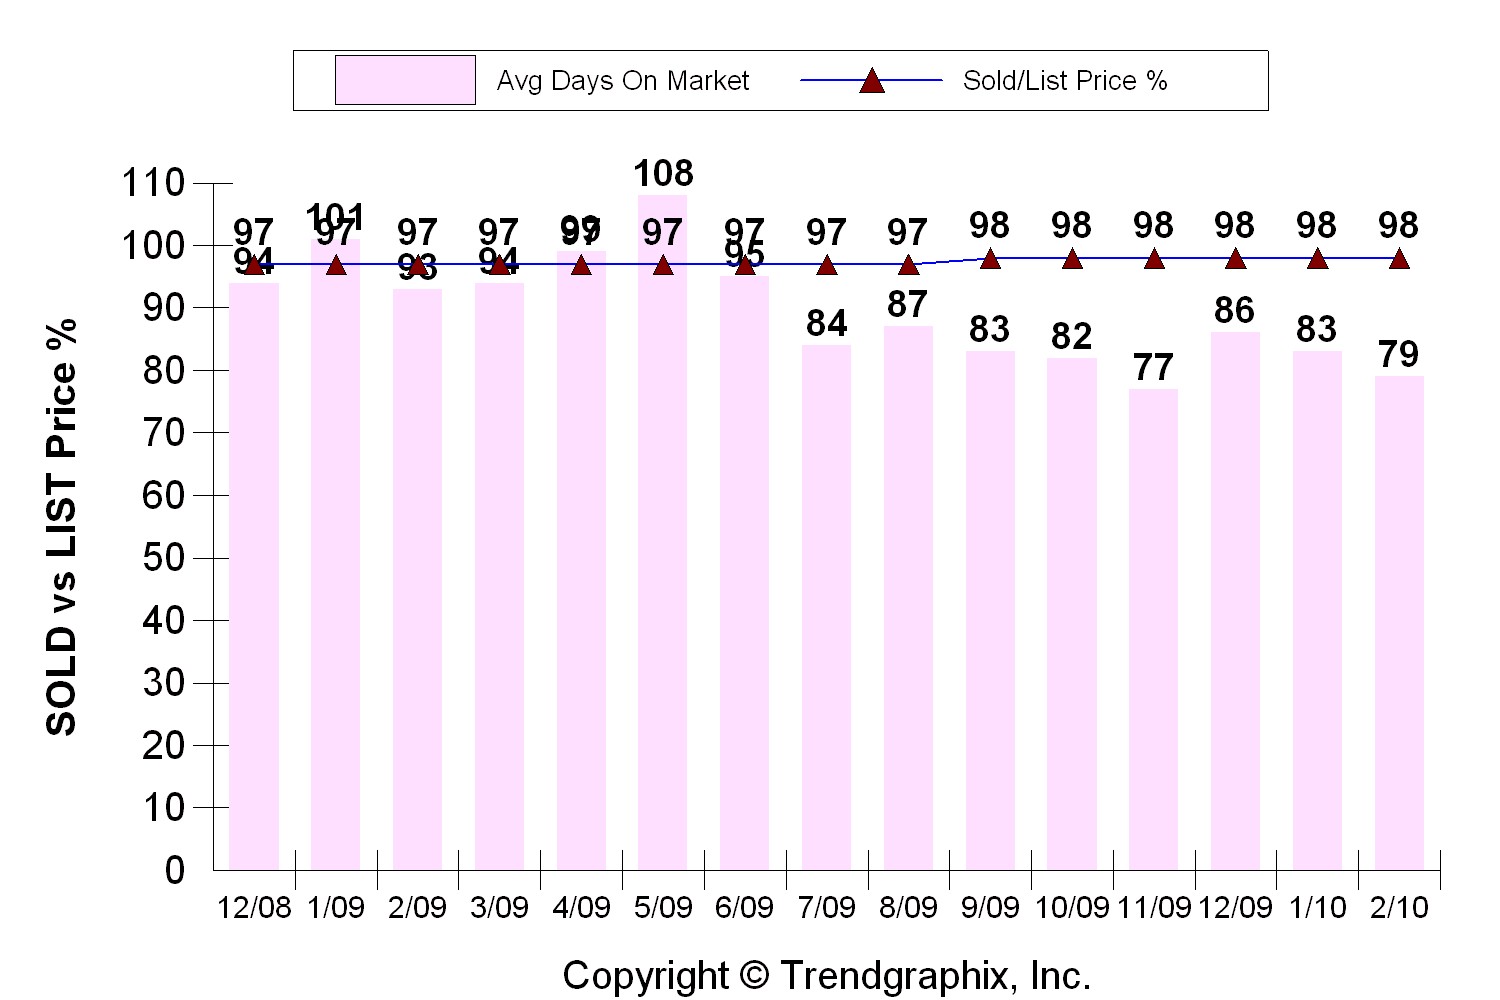
The following charts are all for Snohomish County and the trends are very similar to those of King County.  Pending and sold sales are up VERY nicely and prices are holding steady at an average of $314,000 and $152/sqft.

Sno1

Sno2

Sno3

Sno4

Sno5 

So, the combination of a new year, good weather, tax incentives, and low interest rates have all contributed to a large increase in activity in January and February.  I expect that continue for the next few months, at minimum, so if you're considering making the plunge into a home sale or purchase– Come on in, the water is nice and warm. 🙂