Uncategorized February 9, 2011

Seattle Area Real Estate Statistics for January 2011

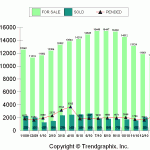
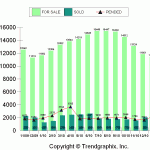
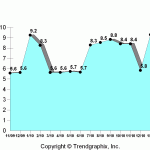
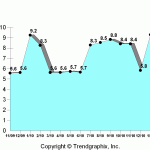
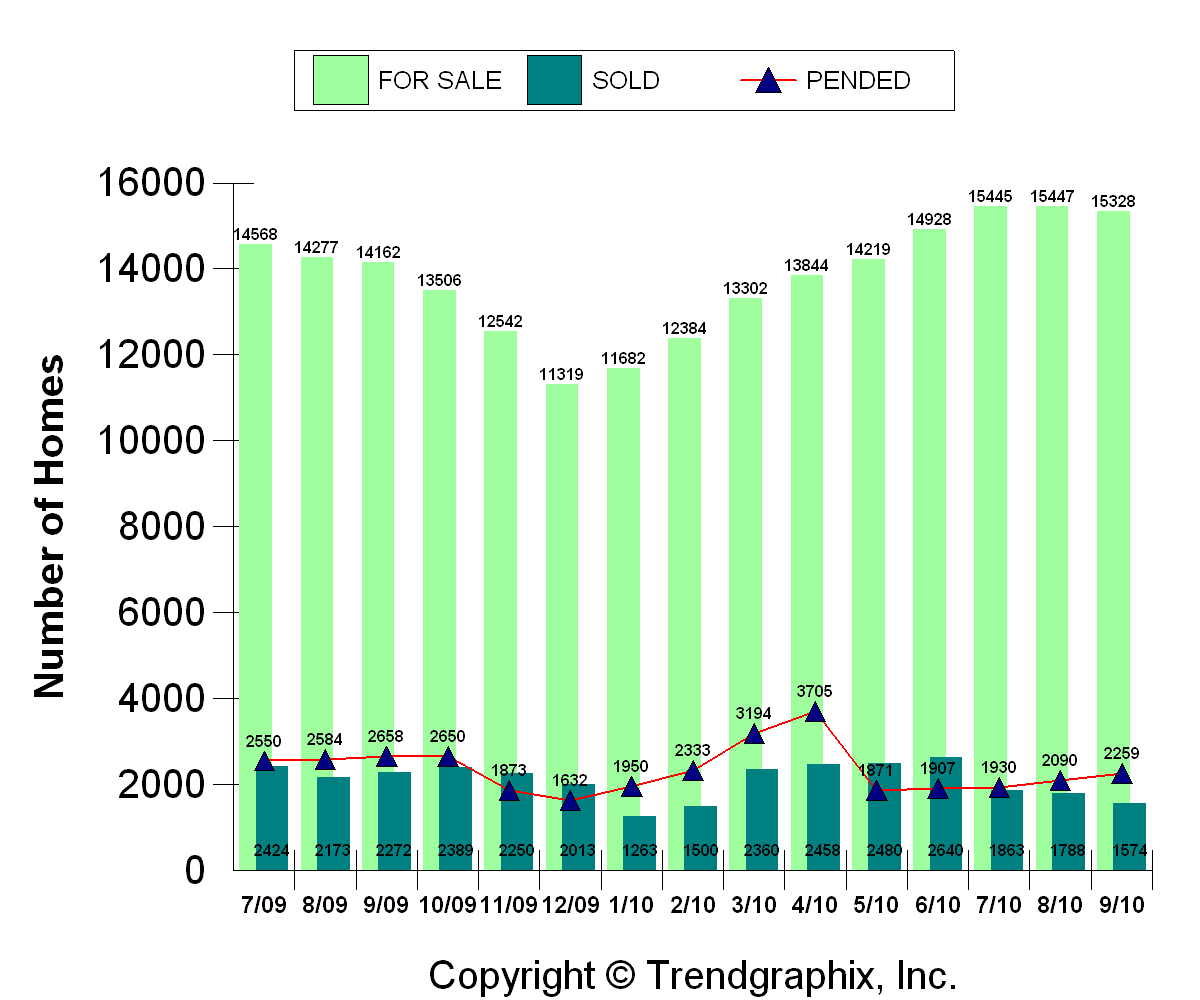
Stats are out for January and there are some interesting things to look at. After the “calm” of the holiday season, we are off to a brisk start to the new year. Open houses were very busy in January and that has seemed to translate into contracts written.

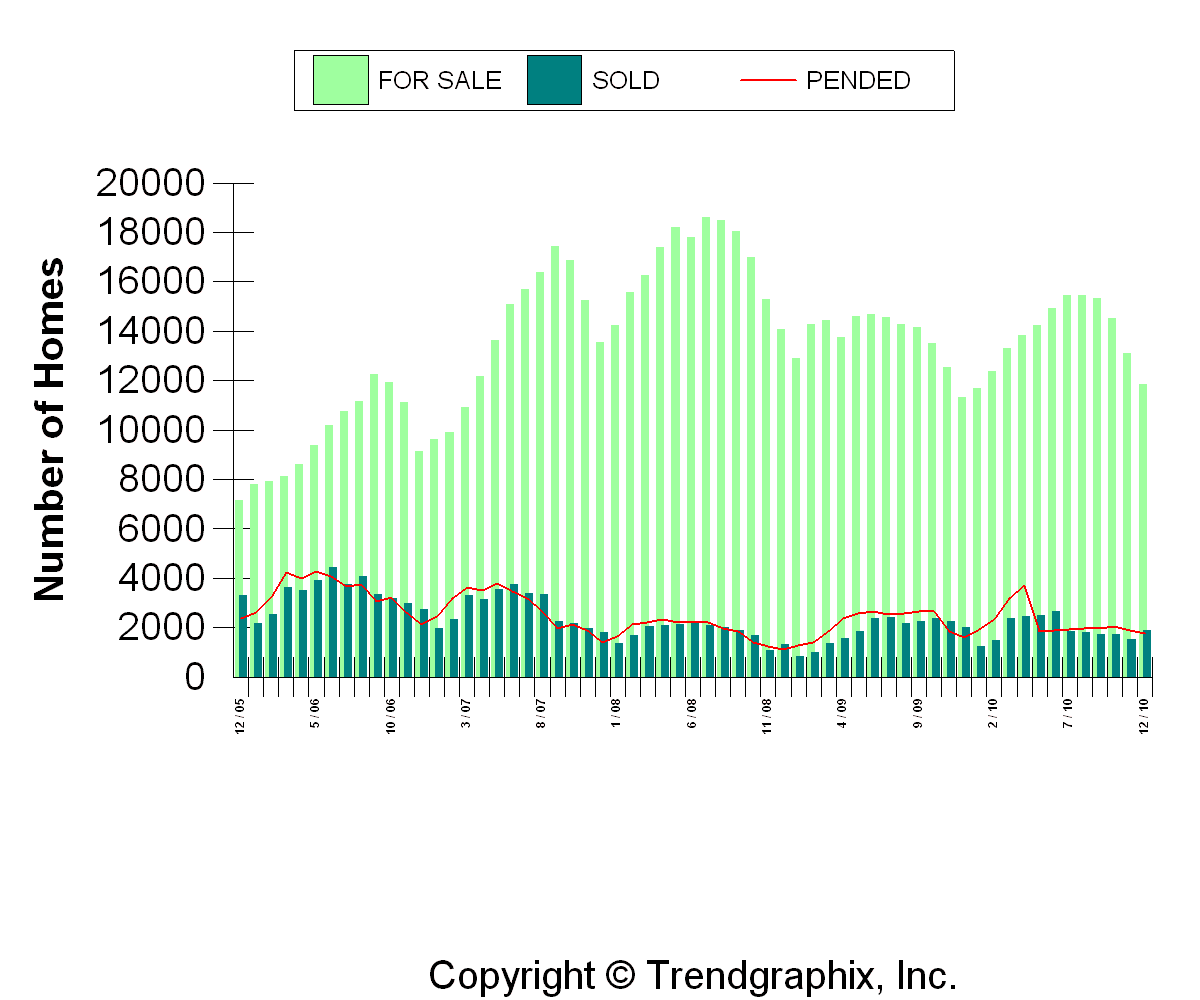
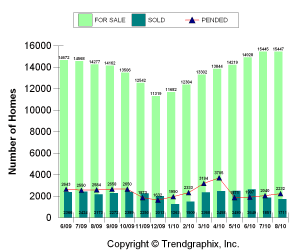
Closed sales decreased in January, which is fairly normal, but pending sales shot up almost 34% from December and over 12% from last January. And active listings decreased slightly from December rather than increasing like they did last January. Remember last year, we had the tax credit that was extended until the end of April so it will be nice this year to NOT have that arbitrary “deadline” for people to make moves. The market should be a little more steady as we roll through the spring and summer seasons.

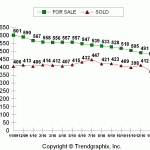
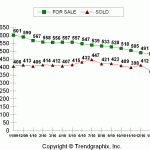
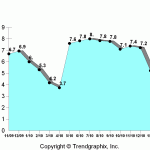
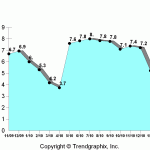
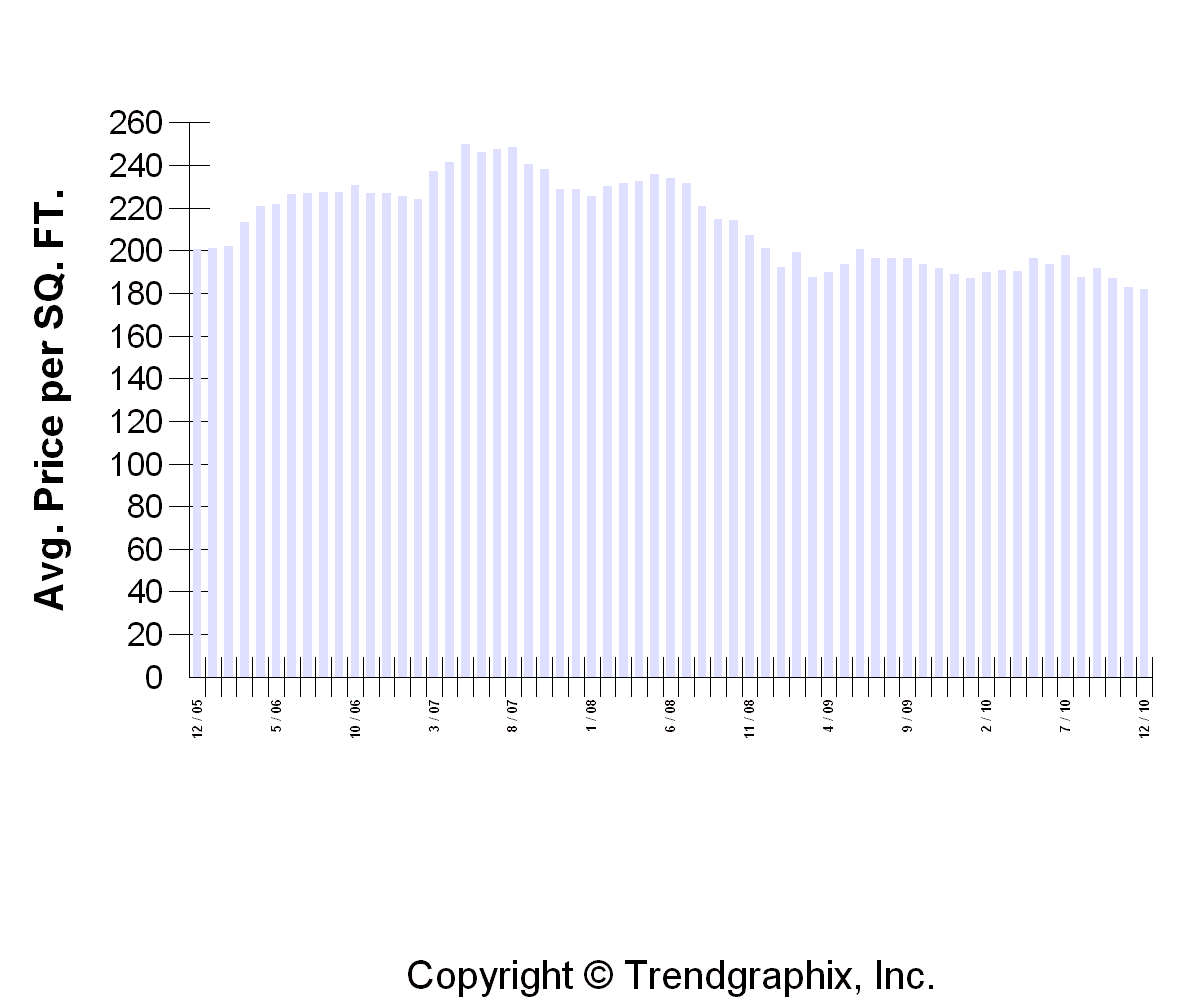
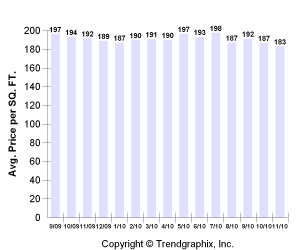
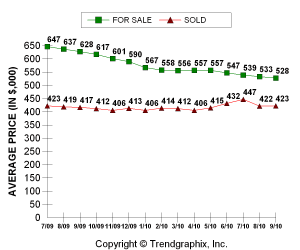
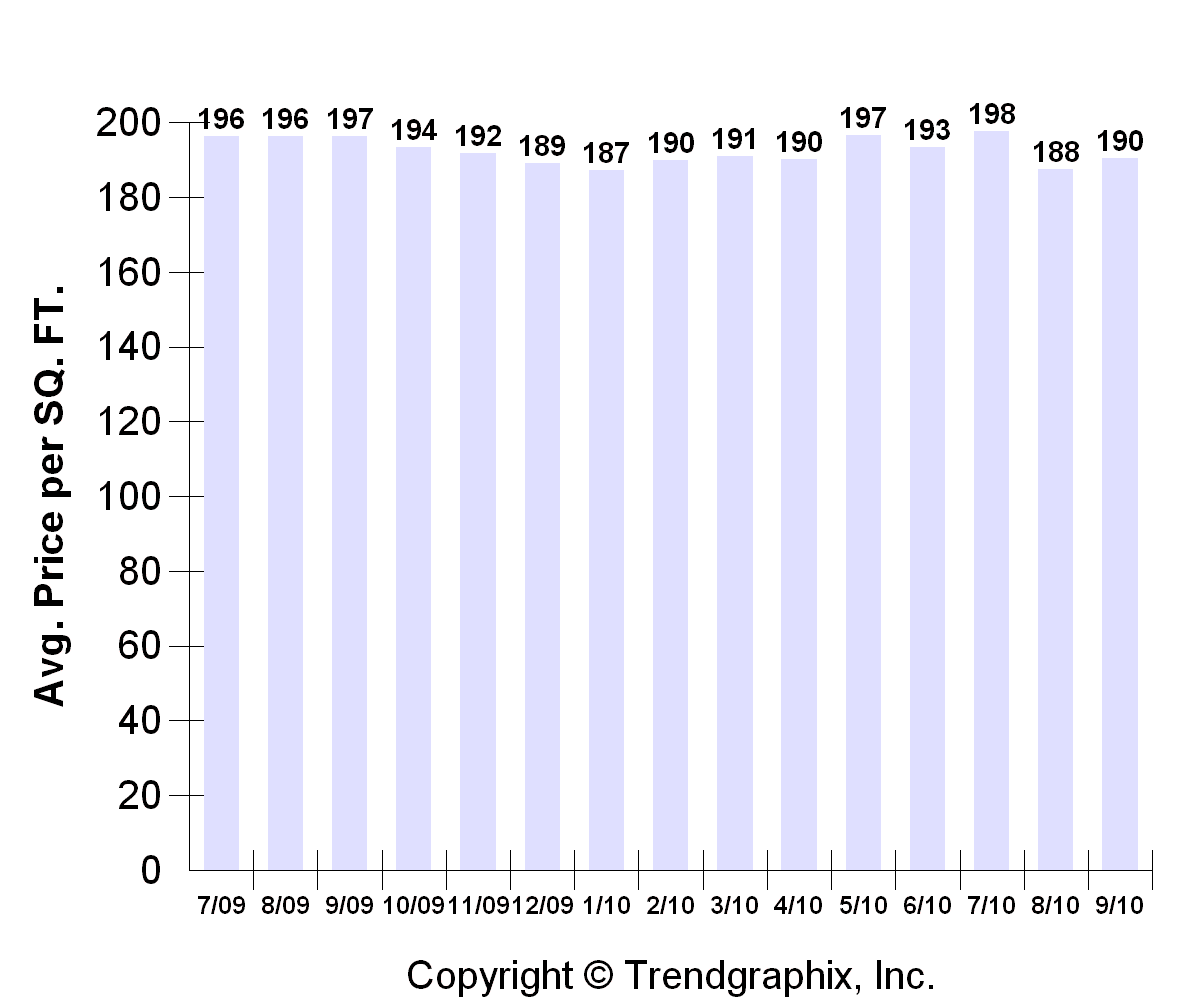
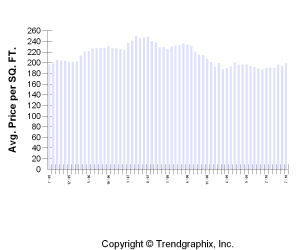
Now as far as prices are concerned, it is a little surprising to see that they dipped to new lows in January… For King and Snohomish Counties combined, the average sales price was $375,000 and $167/sqft versus $412,000 and $181/sqft in December. Now, it’s possible some extra discounting took place to get homes sold at the end of the year, but time will tell if it’s the beginning of a new trend lower or just a headfake. I do see a lot of sellers working hard to make deals with buyers, but now that a lot of the existing inventory of well priced homes is getting sold, there might be a little more competition between eager buyers going forward. That’s pure speculation on my part but rising interest rates and fewer homes to choose from could at least give a little more of a bid under prices as we get into spring.

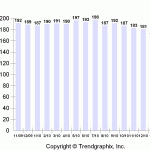
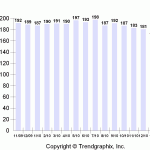
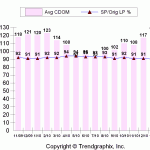
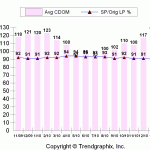
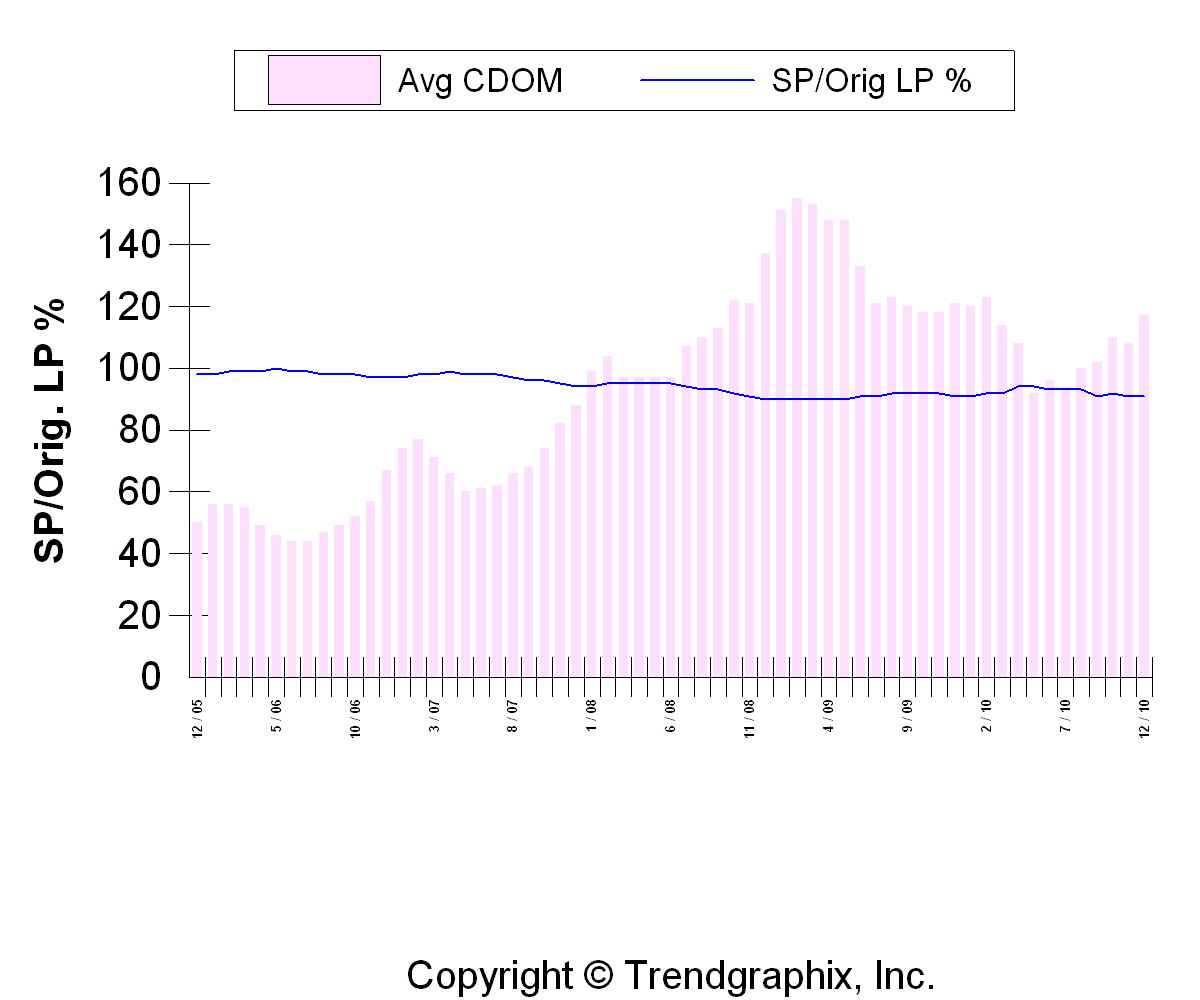
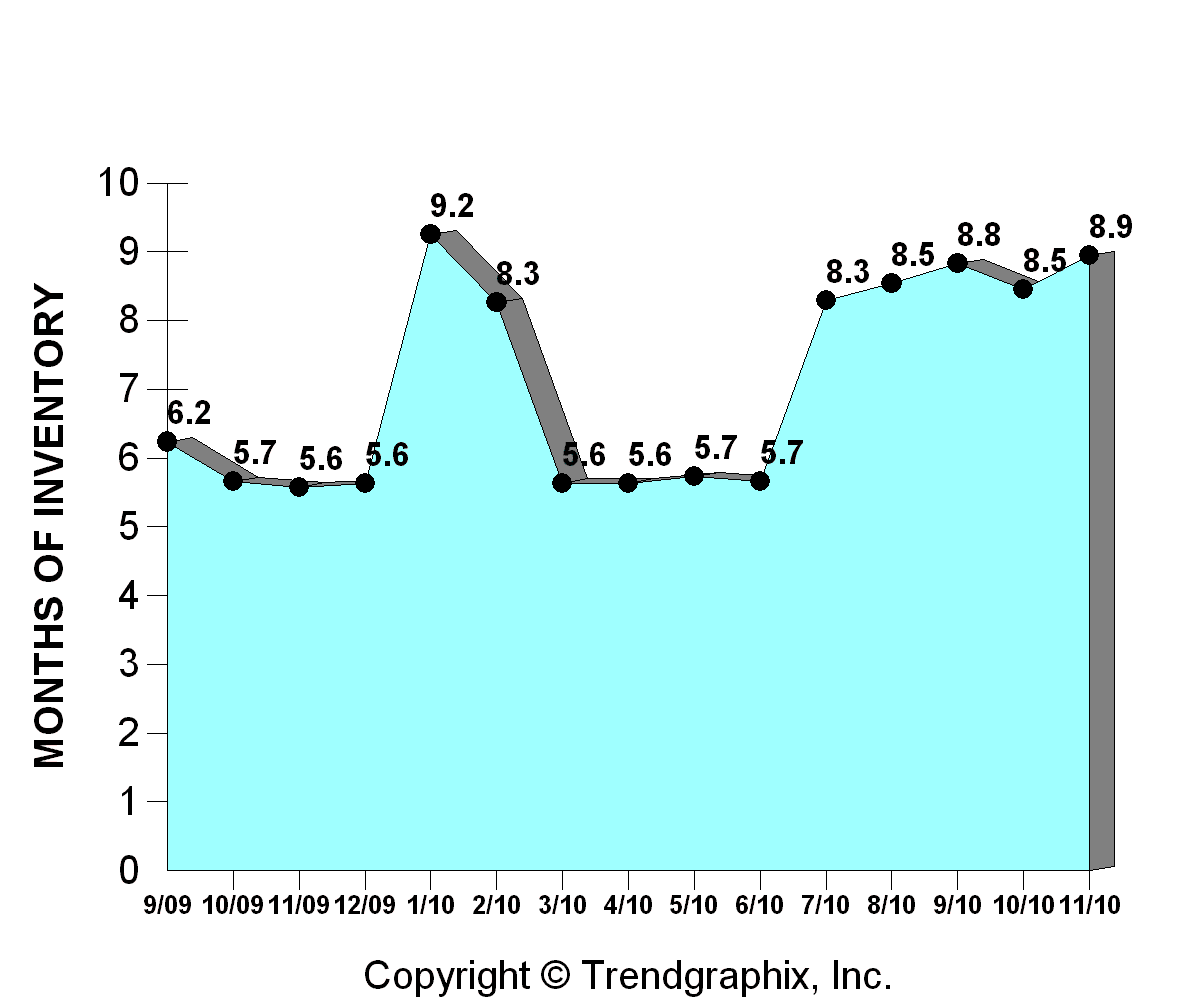
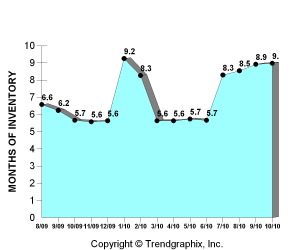
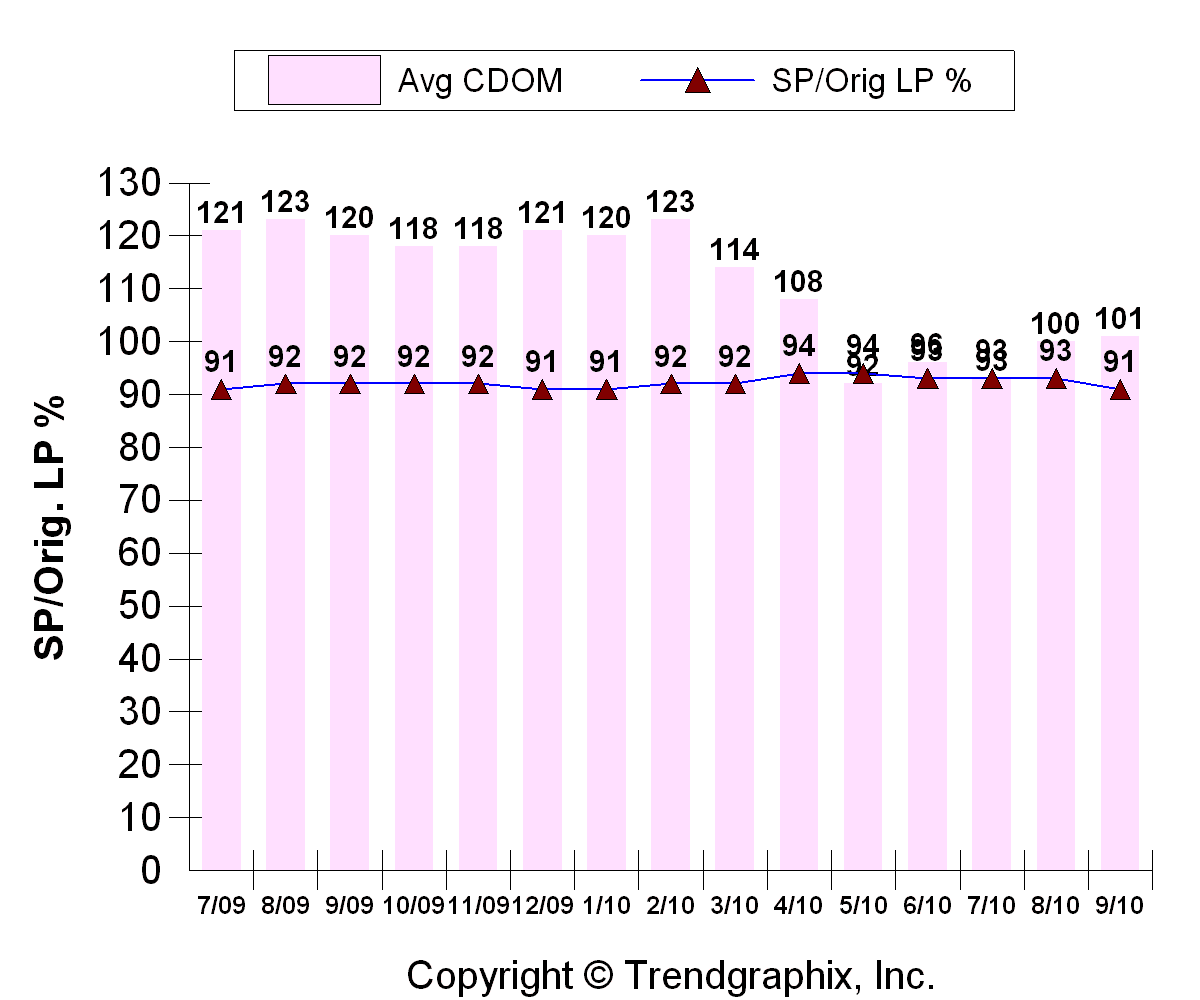
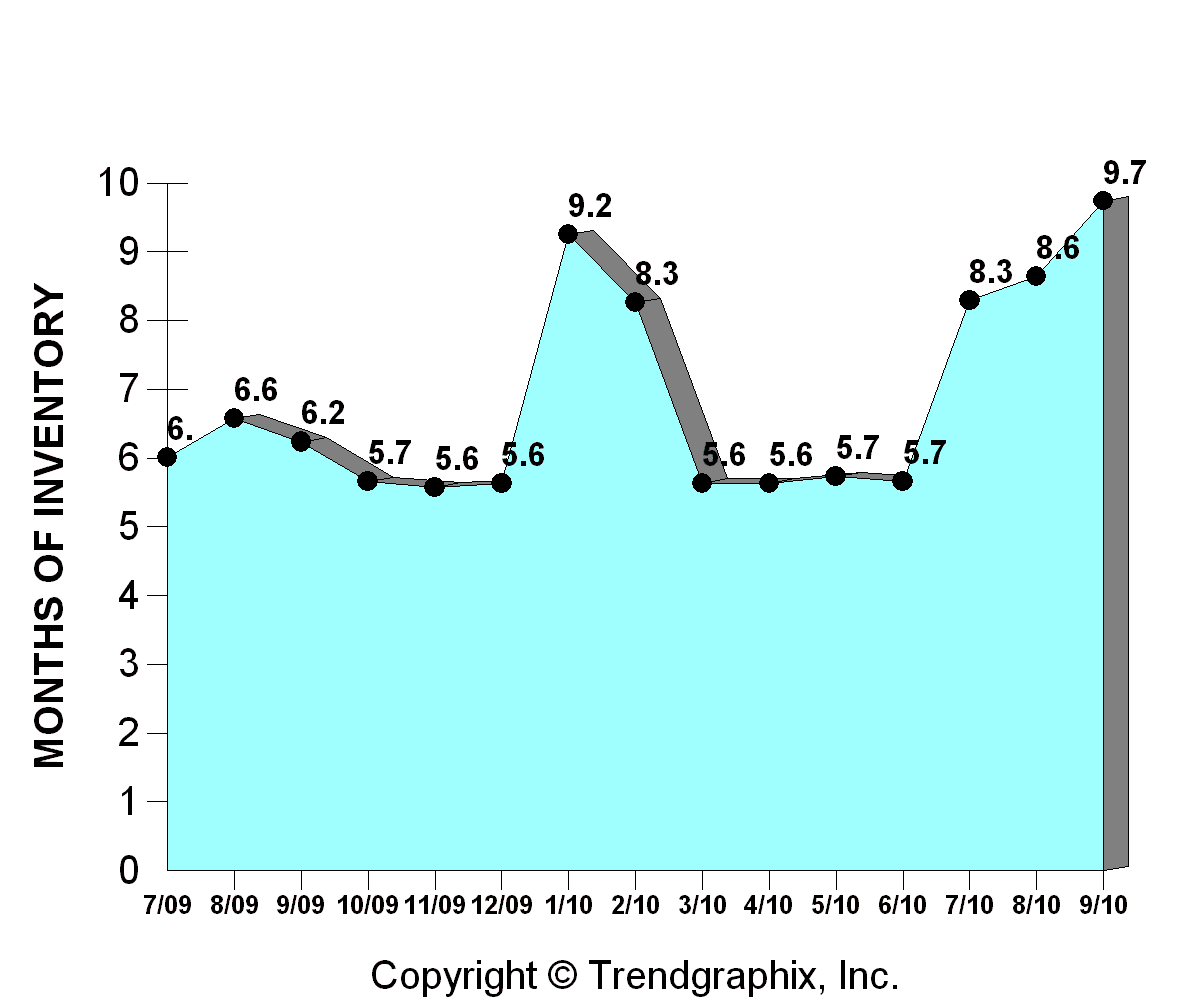
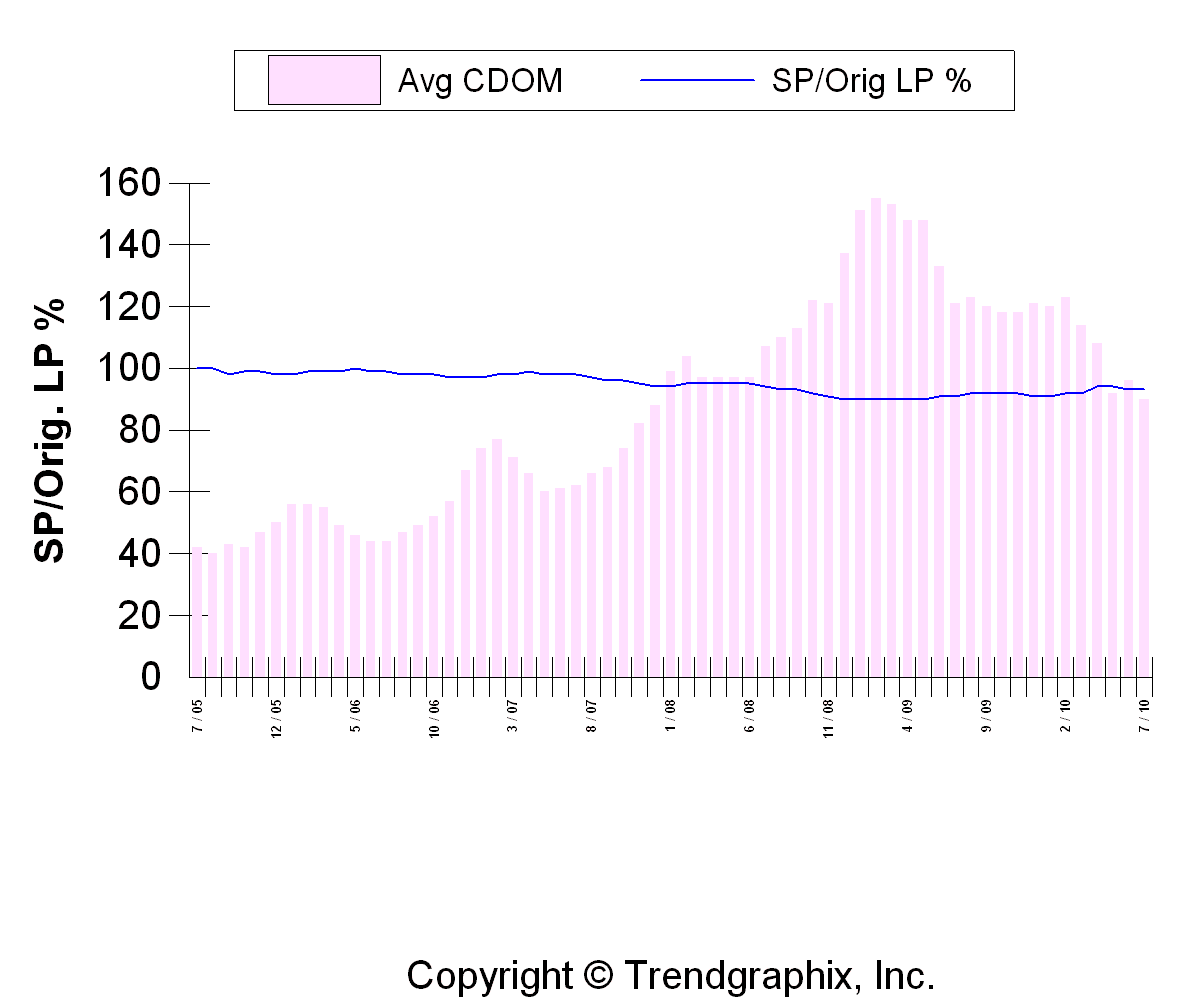
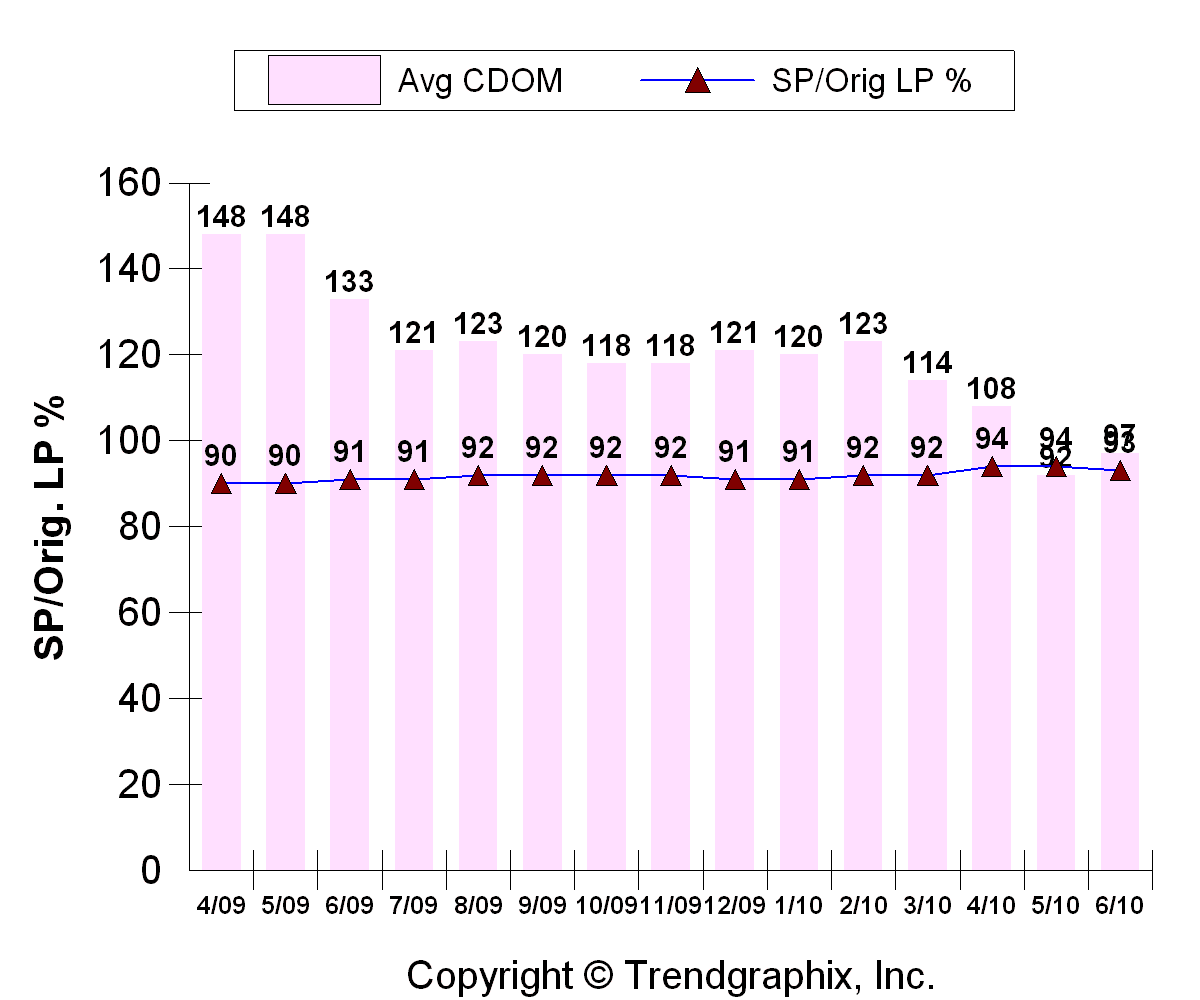
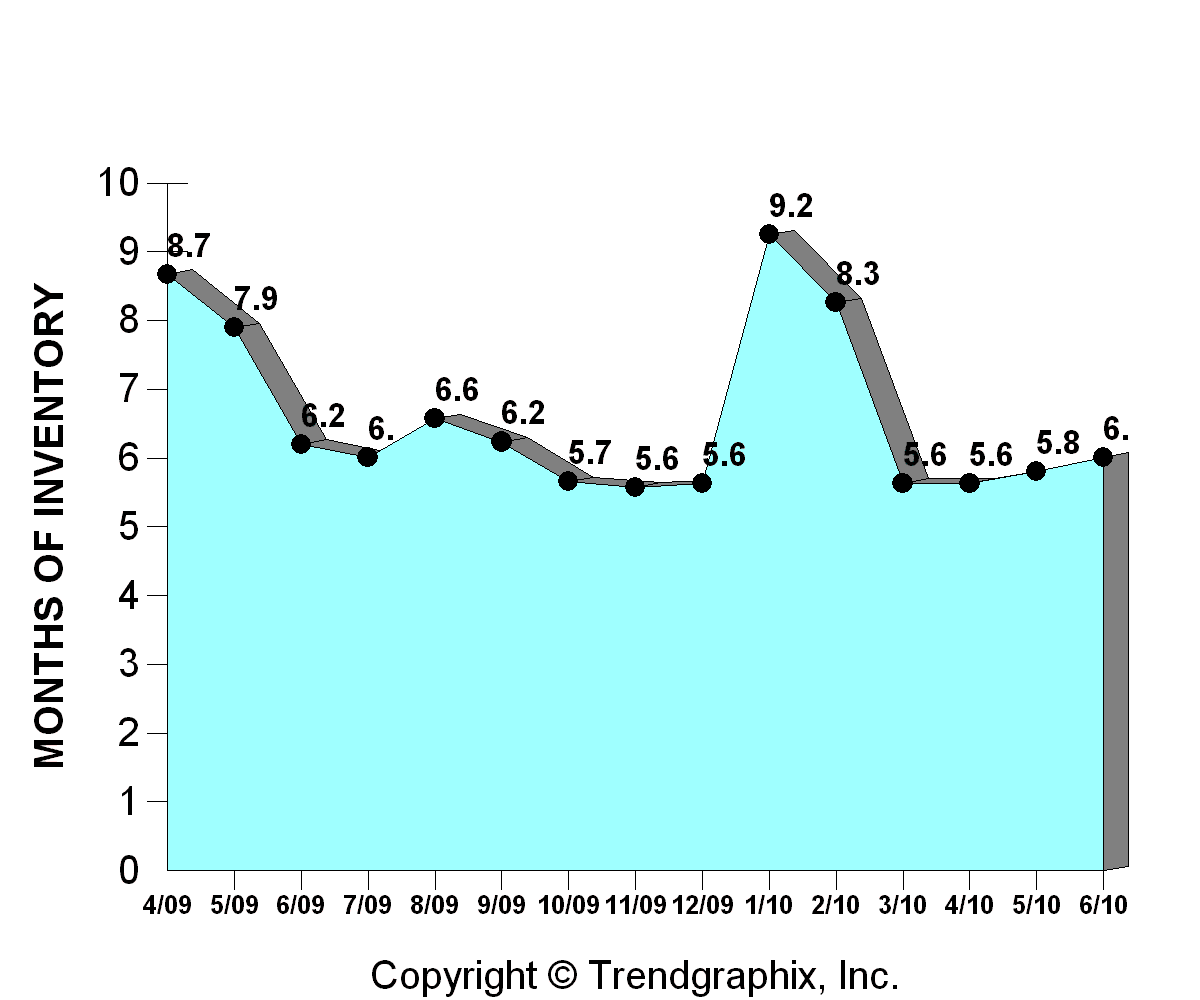
Consecutive days on market bumped up to 125 days while the “Selling Price as a Percentage of Original Lising Price” dipped slightly to 90%. The “Months of Inventory” based on CLOSED sales rose sharply to 9.3 months. But if you look at the same thing based on PENDING sales, inventory decreased sharply to only 5.2 months, which is lower than where it was last January when we had the benefit of the tax credit.

So it’s important to step back and look at the information in a broader context and realize that even the data for closed sales in January is backward looking- I like to look at pending sales to give a better idea of where things are going. And at this point, I’m very optimistic about the market this year and I am looking forward to a busy spring! 

[slideshow]

Uncategorized January 6, 2011

Seattle Area Real Estate Market Statistics – December 2010

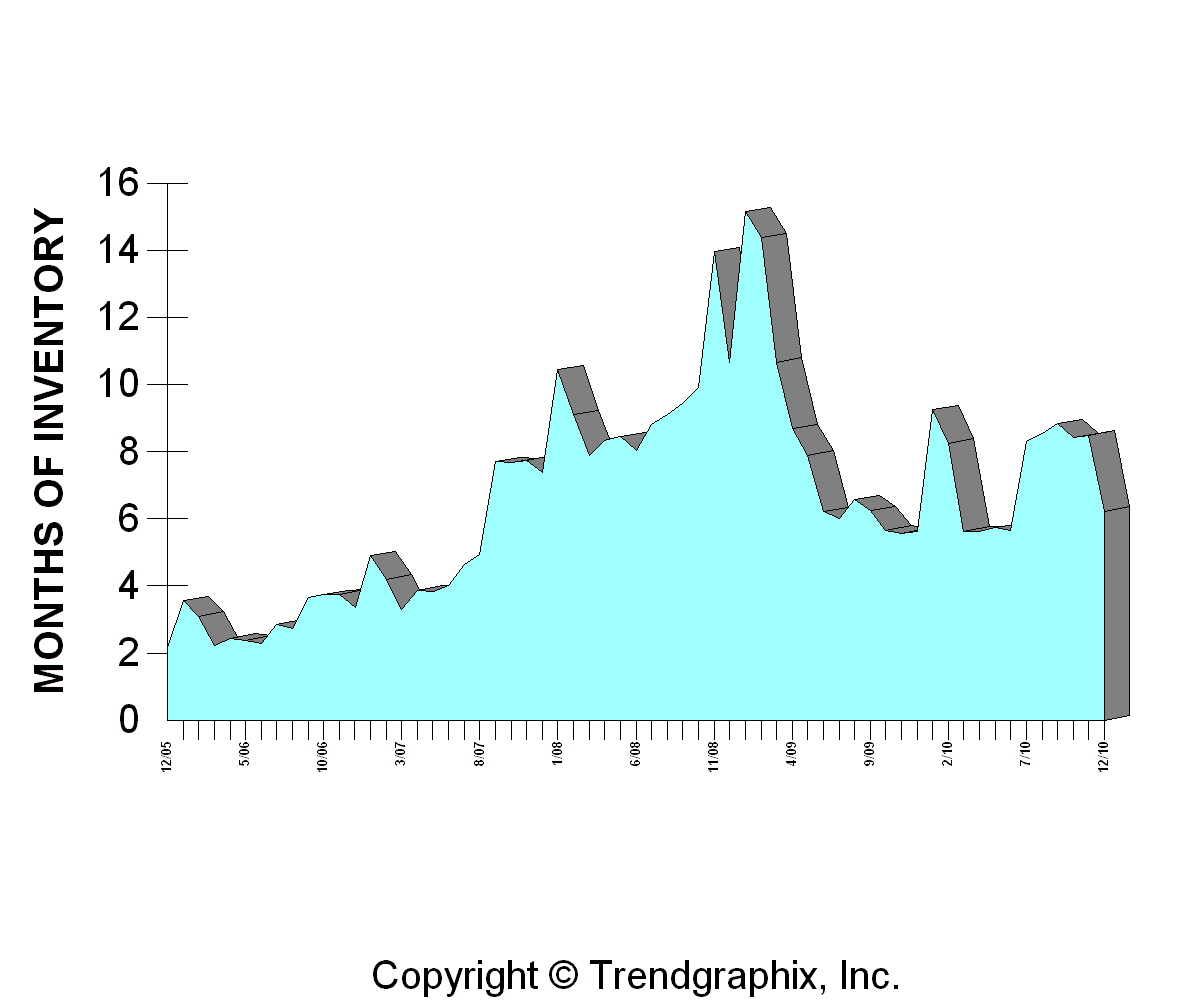
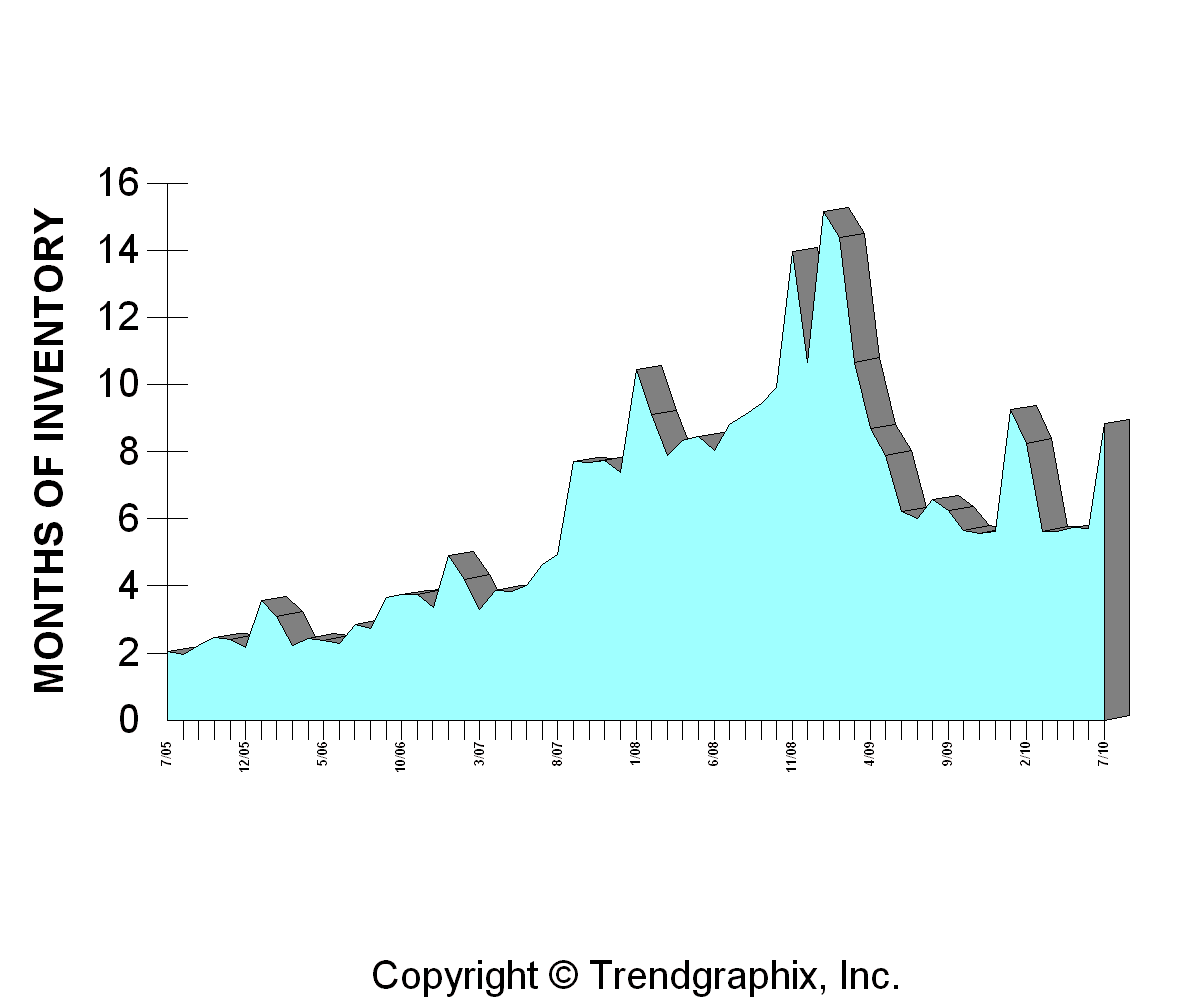
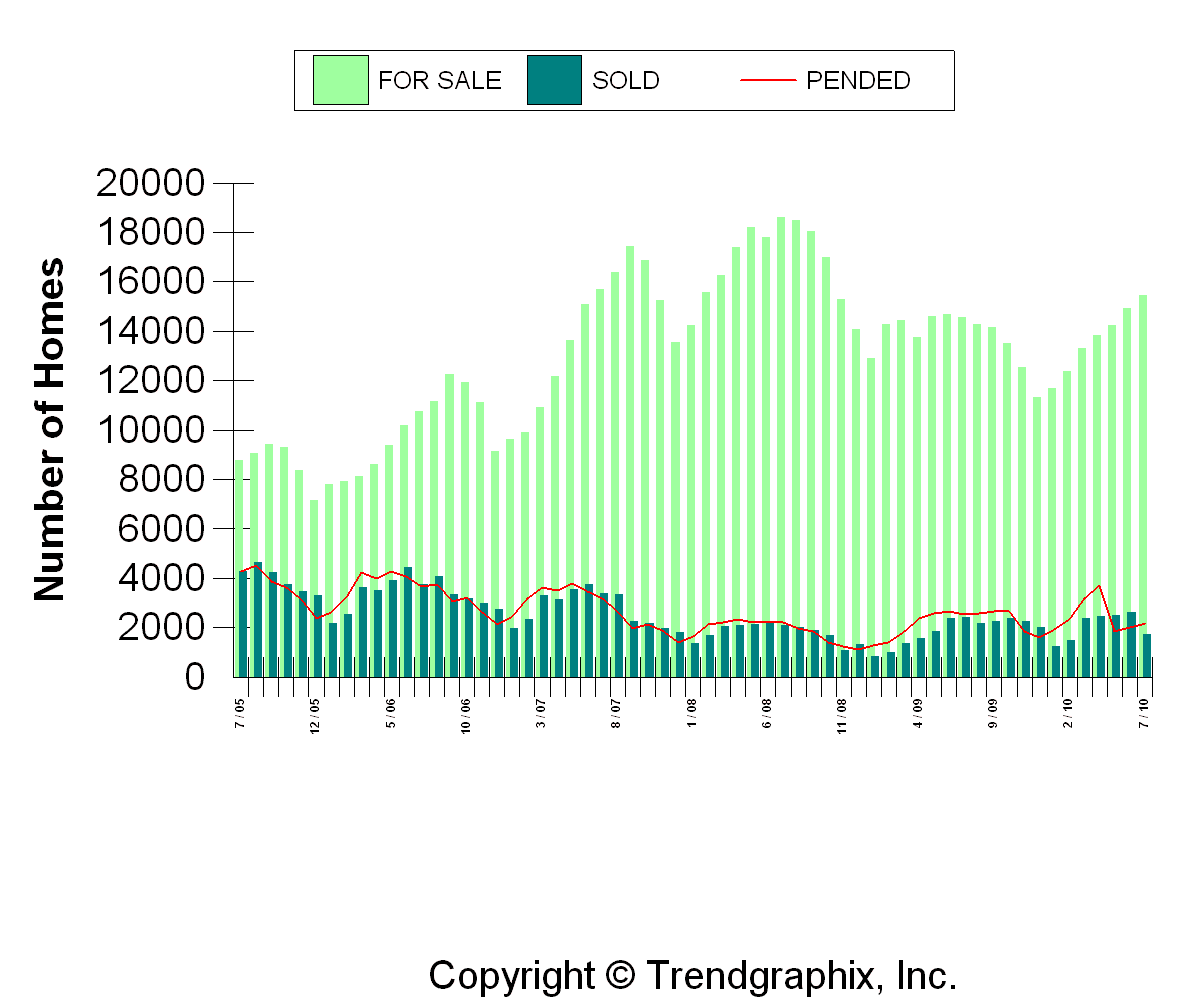
Happy New Year!  To kick off 2011, let's recap the last 5 years of the housing market in King and Snohomish Counties.  At the end of 2005, the market was running on all cylinders and nearly one in every two homes that came on the market sold in a month…  Put differently, there was only about 2 "months of inventory."  We peaked at about 15 months of inventory in early 2009 and we now sit at about 6 months, which historically is actually a pretty balanced market. 

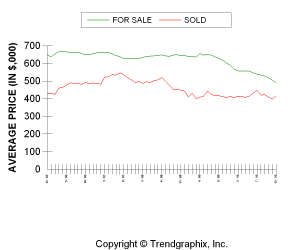
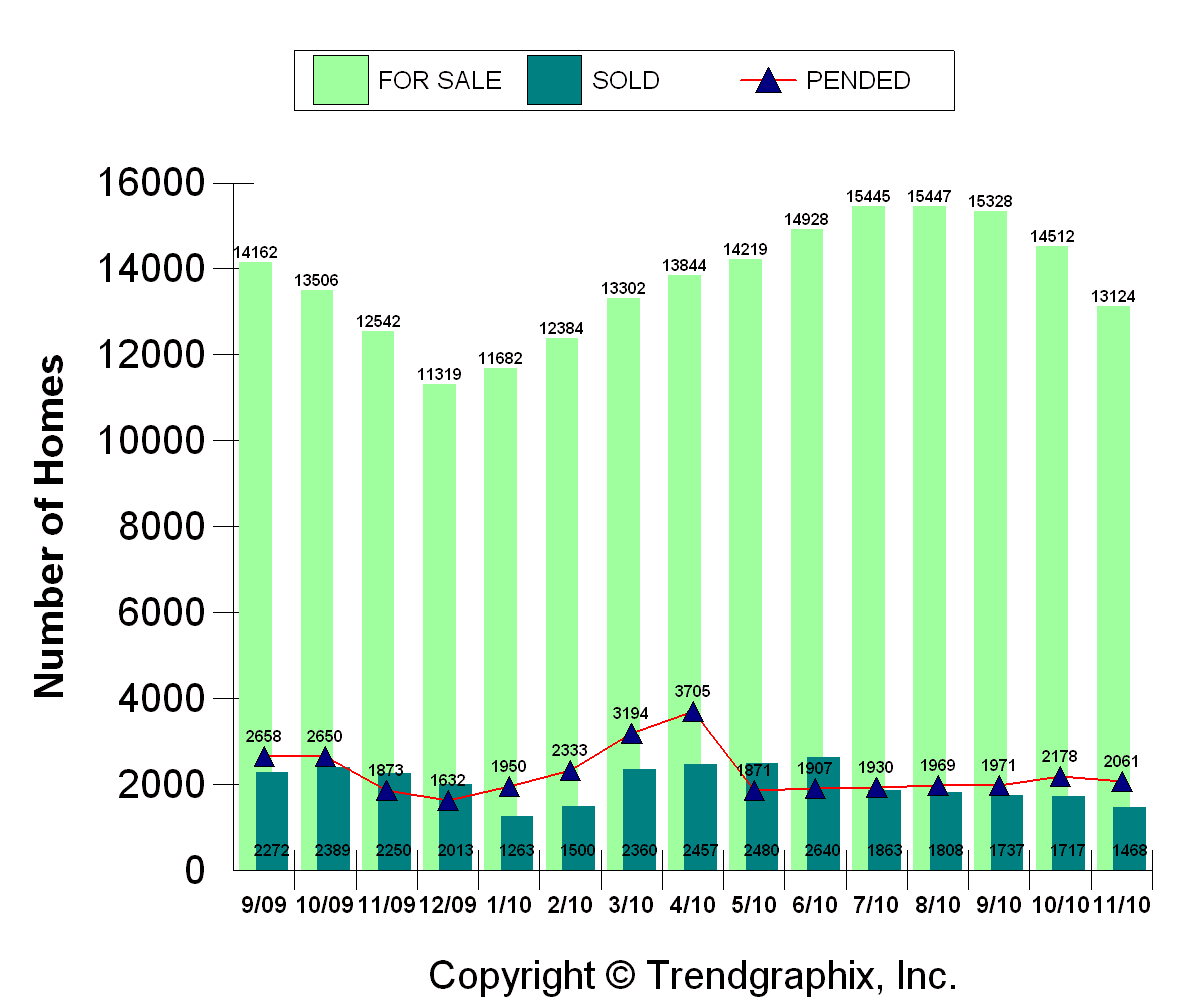
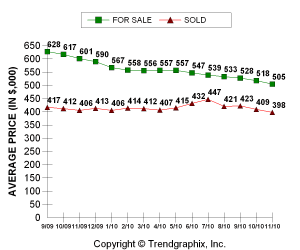
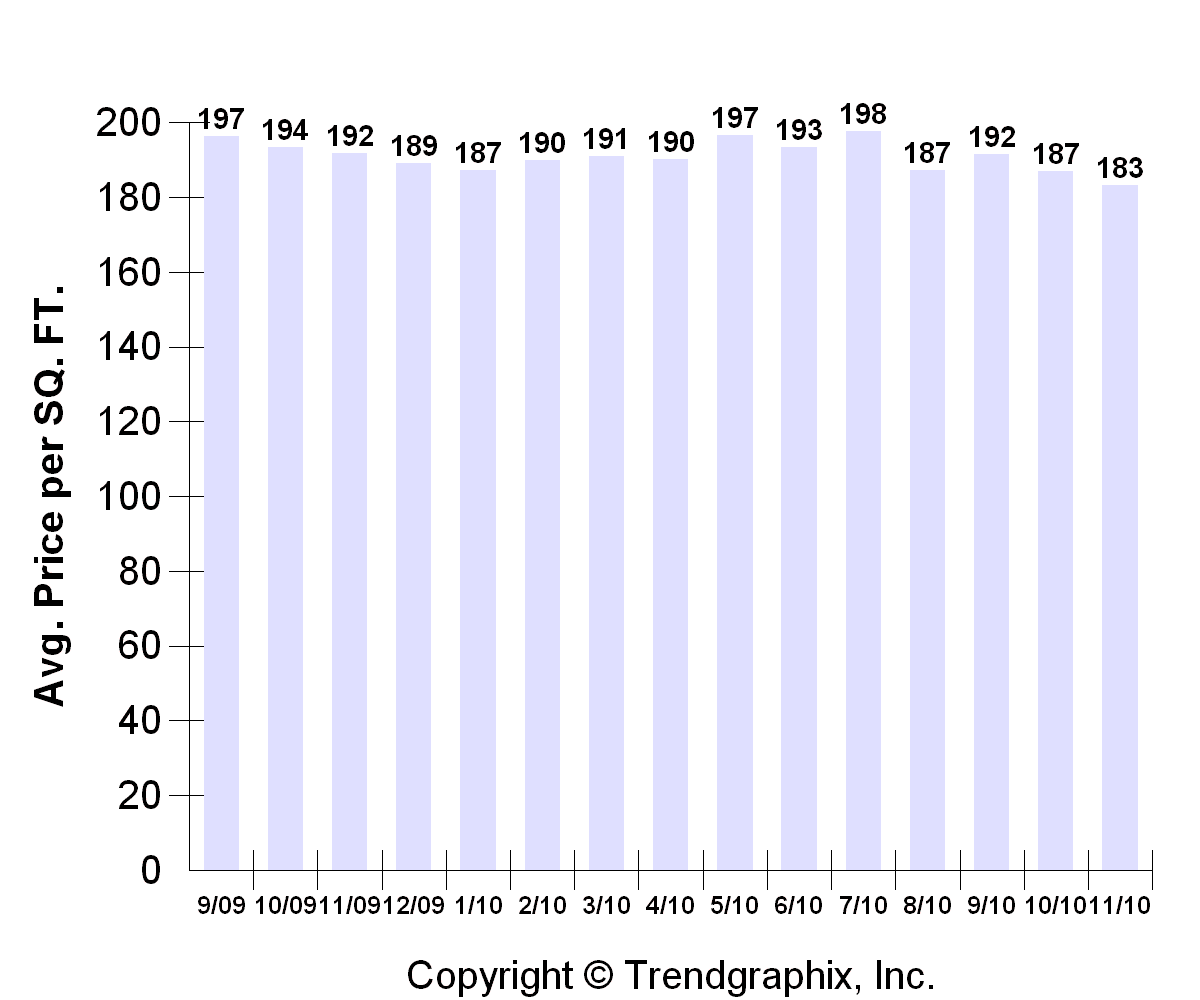
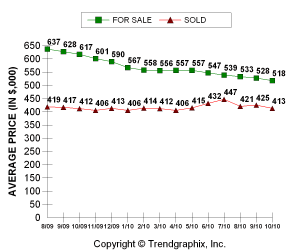
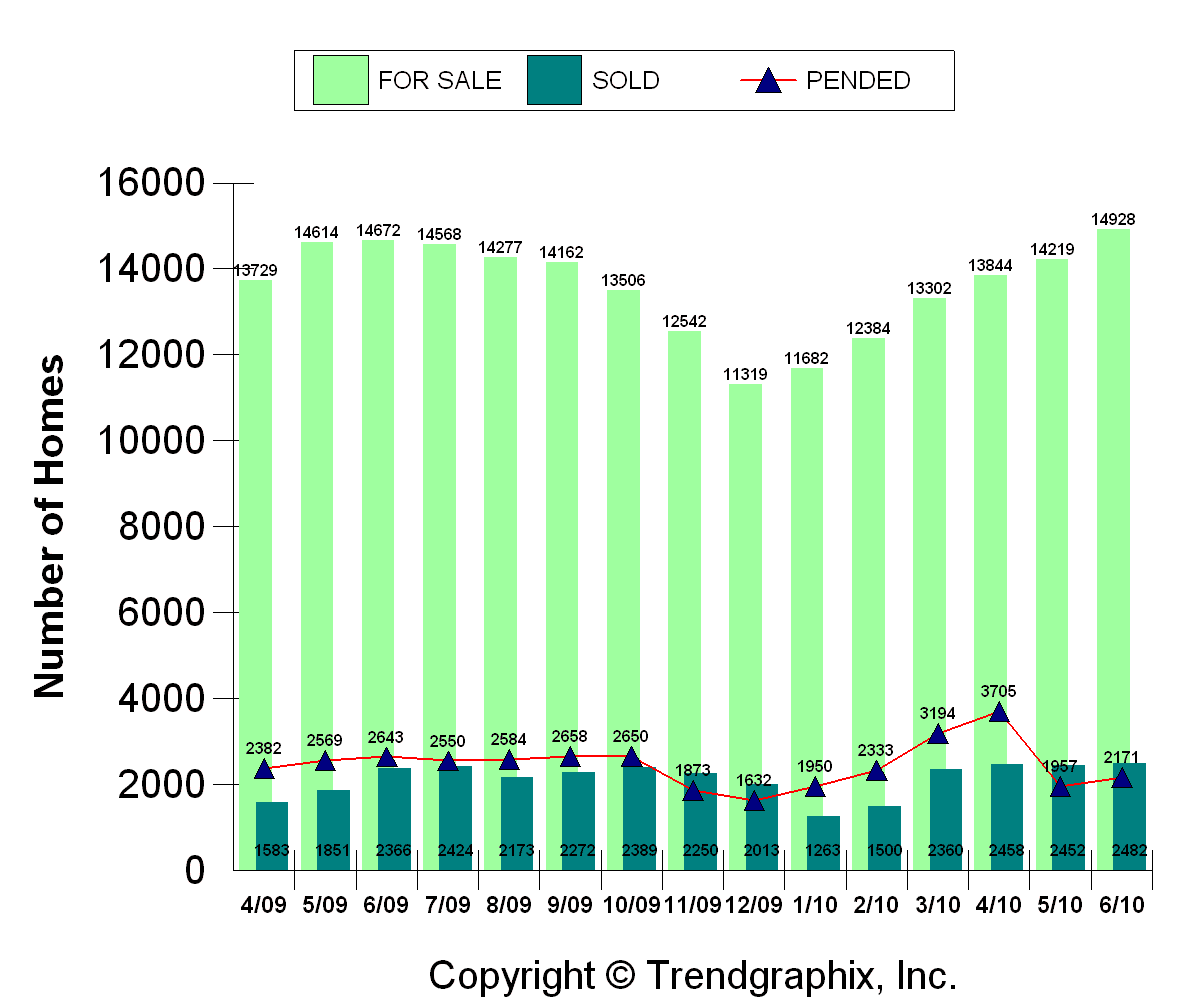
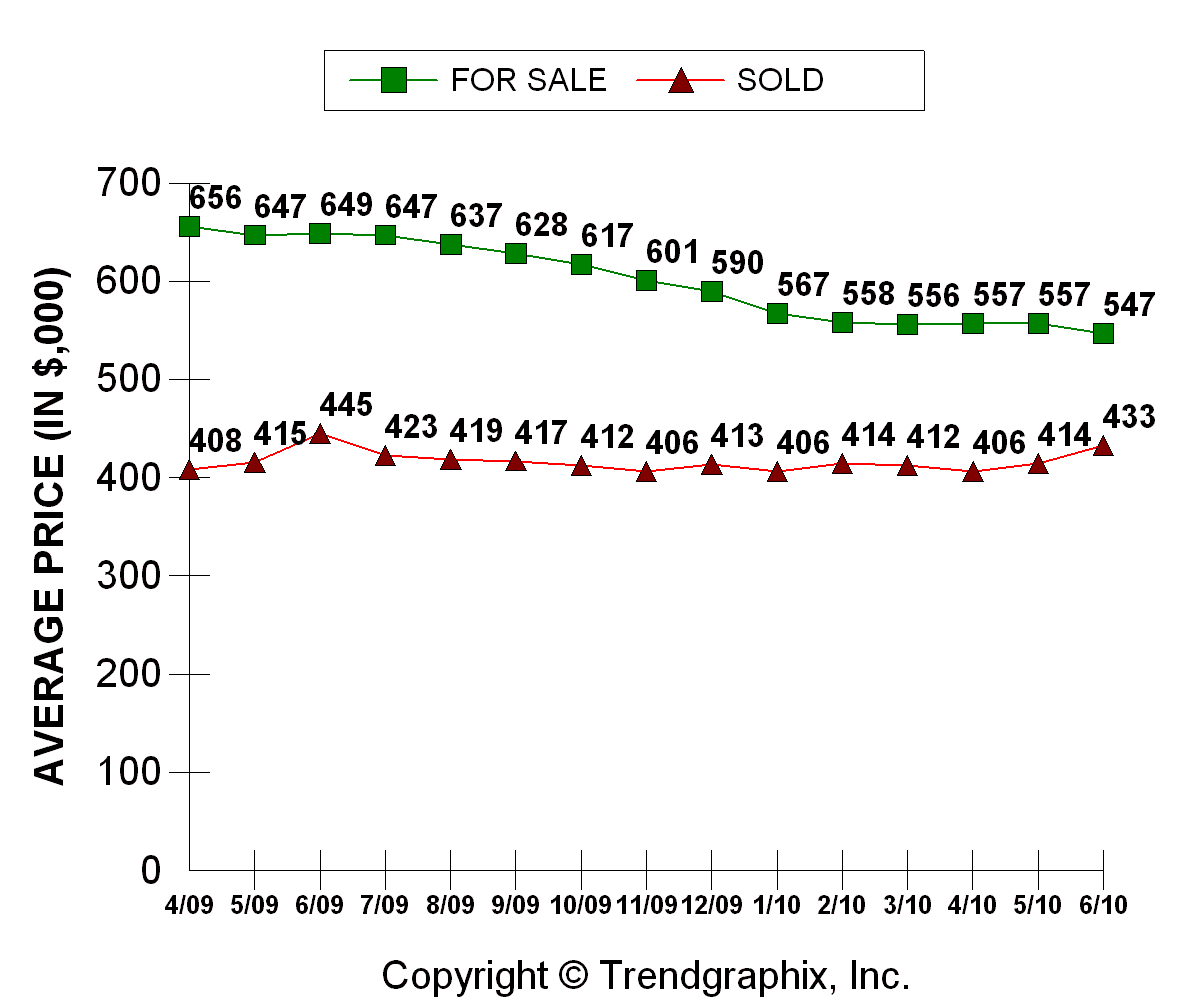
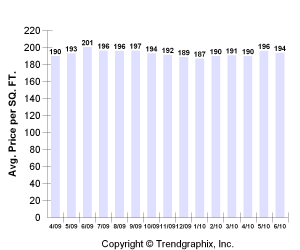
Supply and demand is essentially what drives any market.  As you can see in the green and blue chart below, in 2005 there was a limited supply of homes for sale, yet there was a lot of demand from buyers which pushed prices up.  In 2008, you can see that there was a lot of supply but much less demand so prices came down.  Speaking of prices, we are back to the levels we were at in early 2005.  Sold prices peaked in the middle of 2007 at an average of $546,000 and an average dollar per square foot price of $250.  We are now at $415,000 and $182/sqft which are off 24-27% respectively from their highs. 

Keep in mind that sales prices have been essentially flat for over a year now.  However, one thing that is currently helping the market is that while those sales prices have been flat, listing prices have been consistently coming down.  That means that we are much closer to where buyers and sellers can agree on value versus a lot of the inventory being considered "way overpriced." 

"Consecutive Days on the Market" stood at 50 in 12/05 and that is now more than double at 117 days.  One of the most interesting stats to look at is that the "Sold Price as a Percentage of the Original List Price" was steadily at or above 98% in 2005 and now it is hovering around 91%.  That means that buyers were paying full price, or very close to the original listing price, in 2005.  Now, buyers are much less likely to pay full price, and/or there are many price reductions before a buyer makes an offer.  However, keep in mind that new listings in good condition and at competitive prices will NOT last long on the market, even today.  So, if you're in the market to buy, don't let a good opportunity slip away.  Similarly, there are many good homes that have been on the market a while and after several price reductions, are now at very competitive prices with eager sellers.  There are some great opportunities there as well.  Using a knowledgeable Realtor in the area you're looking at will help you identify those golden opportunities.

In 2011, I expect that the housing market will continue to slowly sell off the excess inventory but probably be pretty steady overall.  There may be a few percent more to the downside on price, but I believe we are really getting close to, or may have even passed, the point where waiting much longer to buy won't pay off much in the long run.  Even if you expect prices to go down more, increases in interest rates could offset any potential benefit of waiting.  So like I've said many times before, don't try to time the market perfectly because you'll usually lose.  If you need or want to make a move for family, job, or most any reason, just find an expert Realtor and do it! 


Ks1 
Ks2 
Ks3 
Ks4 
Ks5 

Uncategorized December 9, 2010

Seattle Area Housing Market Statistics for November 2010

As I've mentioned many times, we have been fairly flat as far as prices go for over a year now.  Well, average prices did hit a new low in November.  For King and Snohomish Counties combined, the average price now stands at $398,000 and the average price per square foot is $183.  These levels are just slightly less than the initial low hit in March '09 and match the levels we were at in early 2005. 

Active listings, pending sales, and closed sales all dropped in November which is common and expected at this time of the year.  Average Days On Market is about the same as last month at 109 days and the Months of Inventory is also holding near its highs at 8.9 months. 

Check back at the beginning of January for December stats and I will also give longer term charts to show the market trend over the past 5+ years. 


Ks1 
Ks2Ks3 
 
Ks4 
Ks5 

Uncategorized November 10, 2010

Seattle Area Housing Market Statistics for October 2010

Let's jump right into the stats for King and Snohomish Counties combined for October…  Active listings decreased 5.3% from September but are up 7.4% from October 2009.  Pending sales are up 13.2% from September but are down 10.9% from last October.  Closed sales declined 5.9% from September and also declined 32.4% from last year at this time.  Active inventory generally starts to ease this time of year so that's not surprising.  The increase in Pending sales in October also seems normal as many buyers get under contract and want to close before the holidays and the end of the year.  It is a little surprising that the closed sales decreased in October, especially in conjunction with the increase in pending sales.  October is generally one of the busiest closing months, but the decline in closed sales may be a factor of longer lender closing timelines.  Sales are happening, but sometimes they are taking a little longer than planned due to some tighter lending standards. 

Ks1 

Average sales prices declined slightly to $413,000 and $188/sqft.  That's down a couple of percent since last month but all in all, prices have been fairly steady for the past year.

Ks3 

 Ks2

Average Consecutive Days on Market increased from 102 days in September to 110 days in October, a 7.8% increase.  That is still less than the 118 days last year, however.  The Selling Price, as a percentage of the List Price, held steady at 91%.

Ks4 

This last chart shows that the Months of Inventory held pretty stable from last month by only rising slightly to 9.0 months.  Unfortunately, this is almost 60% higher than the 5.7 months registered last October. 

Ks5 

To recap the October data, I would say that much of it conforms to the usual seasonal cycles that we see every year.  The good: Prices are holding relatively steady, pending sales are moderately increasing every month, and while inventory is high, it is not spiking out of control.  The bad: Closings decreased from last month while I expected them to slightly increase, days on market are getting longer again, and inventory levels are holding steady near recent highs.

On that note, have a great rest of November and check in again in early December!


Uncategorized November 9, 2010

Time for Reflection

Since real estate activity starts to slow down a bit as we hit the holidays, this is always a good time to take a deep breath and reflect on the year to date.  2010 started with the homebuyer tax credit which definitely put a “bid” under the market and pushed prices up slightly and cleared out some inventory.  The unintended consequence was that it pulled activity forward, which basically took some air out of the market, especially during the summer months.  However, activity recently has been slowly building up again as  historically low interest rates and low prices have pulled many buyers off the fence.  There remains plenty of overhead resistance as far as pricing goes because there is still a lot of inventory and a lot of distressed inventory- short sales and foreclosures.  But it’s going to be a process, probably a multi-year process, whereby the distressed sales need to continue to be flushed out before the market can really become truly healthy again. 

In my opinion, and for better or worse, the Fed is doing everything it possibly can to inflate our way out of this housing and debt crisis.  Unfortunately, that will continue to debase the value of the dollar as well as hurt those who have cash savings or those who rely on a fixed income.  But since a majority of the country seems to have much more debt than savings, inflating our way out of the mess is perceived to be the only “quick” way to reduce that debt to a point where it’s no longer a crisis.  Future inflation is obviously being anticipated as commodity prices have increased while the dollar has fallen.  Many in the financial industry see housing and land as commodities that could also benefit from inflation.  Given that we’re coming out of a housing bubble, it’s highly unlikely that prices will soar anytime soon, but over the longer term, history shows that it should perform at or better than the rate of inflation.  Therefore, as long as you don’t fall into the trap of overleveraging, it’s a great time to buy investment property, or upgrade or downsize your personal home, by locking in a very low interest rate and getting a great deal on a purchase.


Uncategorized October 11, 2010

Seattle Area Housing Market Statistics for September 2010

True to form, activity picked up in September after summer "unofficially" ended around Labor Day.  It hasn't been a barn burner of a month by any means, but it was nice to see open houses get busier and some inventory get sold.  The sales will become more obvious in the stats after this month, but for now, we'll look at how September looks compared with prior months.

These charts are for King and Snohomish Counties, combined…  Active listings declined almost 1% from August, but still up 8% from last year.  Closed sales decreased 12% from August and 30% from last September.  But, Pending sales continued its slow march upward by 8% from August.  That is still 15% lighter than last year, however.

Ks1 

Prices held fairly steady at $423,000 and $190/sqft which is about where we were last year at this time.  Stability is good and I think it will continue for a while.  I think the most interesting thing on this chart is the steady decline in "active" listing prices.  Sellers are getting more and more realistic on expectations and that has nicely narrowed the gap between what buyers want to pay and what sellers are willing to accept. 
Ks2 

Ks3 

This chart shows that the Days on Market also held steady from August at an average of 101 days.  The Sold Price as a percentage of List Price did decline slightly to 91% which is equal to the low point over the last 15 months.

Ks4 

The "Months of Inventory" is back at a new recent high of 9.7 months of inventory.  That is not very good, but on the bright side, if you were to look at this chart based on Pending sales instead of Closed sales, the inventory has declined and is not at a new high.  So, let's look at this again after October has finished and see if this month's closings make a significant difference here.
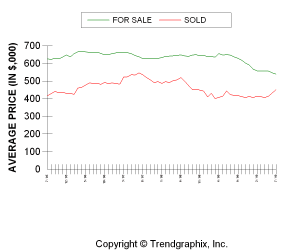
Ks5 

To conclude, it's more of the same in a lot of ways as far as the data goes:  steady prices, lots of inventory, etc.  But, market activity has definitely increased over the last month so we'll see how much of a dent it will make in the stats after October is over and before we head into the slower holiday months. 

Uncategorized September 9, 2010

Seattle Area Housing Market Statistics for August 2010

Summer always seems to leave us a little sooner than most of us want, but one bonus of this time of year is that at least we generally get to see a little pick up in housing activity during the autumn months.  Vacations are over, kids are back in school, and those who have been thinking about making a move now get “down to business” and often try to make that transition before the holidays.  So, after a sluggish summer season, I’m expecting to see at least a mild bounce in activity over the next two months.   

I believe we’re still suffering a hangover from the end of the tax credit, but I think it’s finally starting to slowly improve.  Active listings held steady in August and pending sales bounced 9.4%.  Closed sales did dip 7.6% from July, but pending sales tend to be more of a leading indicator so it’s good to see those go up, especially when active listings stay flat.  However, since August 2009, the numbers are technically worse as there are now 8% more listings than last year, but 13% fewer pending sales and 21% fewer closed sales. 

Ks1 

After prices strangely popped up briefly in July, they’ve dipped back down to an average of $424,000 and $188/sqft.  The $/sqft price is 4% lower than last year, but the average sales price is about 1% higher.  Again, these are the averages for all of King and Snohomish Counties combined. 

Ks2 
Ks3 

Days on Market bumped up to 100 from 93 in July, but that is still 18.7% less than last year.  Selling price as a percentage of the original list price has held steady at 93%.

Ks4 

Finally, Months of Inventory is back near the recent high of 9 months.  That just means there is a lot of inventory which is keeping us in a decent buyer’s market. 

 Ks5

Like I said last month, I thought August would be another mixed bag as it is generally the last of the slower summer months- and it was.  But now as we hit September and the fall season, I do have higher expectations for the next two months.  Interest rates continue to be at historic lows, and well qualified buyers should have very little problem getting a mortgage.  There are some very nice homes available at fantastic prices so if you are a buyer, and especially if you are a renter, get out there and take advantage of all the great opportunities.

Uncategorized August 9, 2010

Seattle Area Housing Market Statistics for July 2010

July stats are out and it's a little bit of a mixed bag as far as the data goes.  I'm posting 5 year charts to give a little perspective on what's happened over the last half-decade but I will zero in on the past year or so. 

Inventory is up since June and it is also higher than last year at this time.  Pending sales have increased 8.5% over June but are down almost 28% since last July.  Sold (closed) homes have decreased 33% since June and are also down 13.8% from last July.  Basically, the increase in pending sales is positive, but the decline in closed sales and the increase in active listings are both negative.

Ks1

I mentioned that the data was a bit of a mixed bag and to further that thought even more is that average sales prices in our area actually edged up 4.2% over June and are 6.6% higher than last year at this time.  I would have expected them to hold steady or even possibly decline a little, if for no other reason than there is simply more competition between active listings. 

For King and Snohomish Counties combined, the average sales price in July was $451,000 and an average of $199 per square foot. 

 Ks1a

Ks2

Average Consecutive Days on Market declined 6.2% from June to 90 days.  That is a little surprising to me since we do have more inventory while at the same time, closed sales declined.  Pending sales did rise a little bit but I don't think it was enough to significantly decrease the days on market.  It's possible that some sellers have "given up" and let their listings expire because either they're underwater and "can't" sell for enough to break even or it no longer makes sense to sell at this price or at this time.

Also, you can see that the Sold Price as a percentage of the Original List price is holding steady at 93%.  I've mentioned this before, but if you'll notice back in the frenzied seller's market of '05, that stat was 100%…

Ks3

Months of inventory has spiked up to 8.8 months.  That is higher than what I would like to see, but it is likely to decrease as we head into the fall months, when buyers start making their purchases before the end of the year.

 Ks5 


To summarize, my interpretation of the data tells me that the current market is in a sideways and choppy trend.  It's a mixed bag with pluses: increasing prices, increasing pending sales, steady days on market -and minuses: increase in inventory, fewer closed sales.  But, those pluses are very good things and not necessarily expected.  So, we could get another month of mixed data from August, as it tends to continue to be one of the slower summer months.  But hopefully, buying activity will pick up again like it often does come September when many people start to make their fall moving plans.  With historically low interest rates and a plethora of homes to choose from, the question isn't whether it's the right time to buy, it's how do I choose between all the great choices. 🙂

Uncategorized July 10, 2010

Seattle Area Housing Market Statistics for June 2010

June stats are out and while we're still seeing some sogginess with pending sales after the end of the tax credit, they did tick up slightly in June after they deflated in May.  While sold and pending sales went up slightly from last month, so did new listings.  We have more active listings currently than we did in any month last year.  So, it will important that the number of buyers also increase so that inventory doesn't get way out of balance again, which could be a contributing factor that would put pressure on prices.

Ks1

Prices have held up quite nicely, holding fairly steady for the past year.  Listing prices have come down over 15% in the past year, which is really helping to narrow the gap between what sellers want to sell for and what buyers want to pay. 

For King and Snohomish Counties combined, the average sales price in June was $433,000 and an average of $194 per square foot. 

Ks2 

Ks3

Average Consecutive Days on Market went up just slightly to 97 days.  They've dropped to new recent lows over the past 2 months I'm sure due to the credit.  Now that those homes have closed, it will be interesting to see if they head back up to 100+ days or not.  My prediction is that market time will increase, especially given the new influx of inventory.  HOWEVER, remember that your home does not have to take this long to sell if it is marketed and priced correctly from the get go.  These are just averages, after all.

Also, you can see that the Sold Price as a percentage of the Original List Price is at 93%, down from 94% in May.  I'll keep a close eye on this because it could decline if prices do get pressured lower.

Ks4

Months of inventory is still doing ok at 6 months, but that is up slightly from 5.8 in May.  If inventory does start to lean the wrong direction, this chart will head back up to the recent highs.  I really would like it to stay in the 5-6 month range which would mean a nicely balanced market between buyers and sellers.

Ks5

Now that most of the tax credit sales have closed as of the end of June, we will see how the market fares with one less outside influence.  There could be another downswing or the amazingly great interest rates could light a little fire under the market.  Obviously, it's hard to predict and there are no guarantees.  Most likely, I think we're going to continue to stay in a fairly flat range for quite a while, and that's probably the healthiest thing to continue to clear out all the excesses in the system.

Buyer TipsReal Estate Stats and TrendsRealtor BenefitsSeller Tips July 7, 2010

The Price of Money

For what it’s worth, prices have remained steady and the lure of extremely attractive mortgage rates do seem to be getting some buyers to take action. It’s debatable, but many think that interest rates will rise, sooner or later, if for no other reason than they “can’t get any lower.” For a fun little example, let’s do the math on one scenario. Currently, if you were to put 20% down on a $400,000 home, an 80% LTV (Loan to Value) mortgage balance of $320,000 would have a monthly principal and interest payment of $1,598 for a 30yr fixed loan at 4.375%. Now, if prices were to decline 20%, but mortgage interest rates rose 2% to 6.375% (last seen in 2008), the same property now priced at $320,000 but with an 80% mortgage of $256,000, would have the same monthly mortgage payment of $1,598!

Obviously, there are many factors to consider in a home purchase or sale, so contact me for a free consultation for your situation and I will help you sift through all the “noise.”